


To assess the self-perceived quality of life of institutionalized adults with cerebral palsy and to identify factors that influence their well-being, including sociodemographic, clinical, and diagnostic characteristics, as well as the degree of institutionalization.
MethodA descriptive cross-sectional study was conducted using the San Martin Quality of Life Scale among adults with cerebral palsy. Data were collected in 2021 and 2022 in a sample of adults with cerebral palsy in Navarra, Spain. Multivariate regression was used to explore the relationship between quality of life and various influential factors.
ResultsThe self-determination dimension positively influenced quality of life scores, whereas the social inclusion dimension had the opposite effect. Descriptive and regression analyses revealed that factors such as residing outside the city and a high degree of dependency had a negative influence on quality of life, while the degree of institutionalization had a positive impact.
ConclusionsIt is important to highlight the positive effects of the degree of institutionalization on rehabilitation and well-being, as it seeks to enhance autonomy and social integration when talking about patient-centered models of institutionalization.
Evaluar la calidad de vida autopercibida de adultos con parálisis cerebral institucionalizados e identificar los factores que influyen en su bienestar, incluyendo características sociodemográficas, clínicas y diagnósticas, así como el grado de institucionalización.
MétodoSe realizó un estudio descriptivo transversal utilizando la Escala de Calidad de Vida de San Martín en adultos con parálisis cerebral. Los datos se recogieron en 2021 y 2022 en una muestra de adultos con parálisis cerebral de Navarra, España. Se utilizó regresión multivariante para explorar la relación entre la calidad de vida y diversos factores influyentes.
ResultadosLa dimensión de autodeterminación influyó positivamente en las puntuaciones de calidad de vida, en tanto que la dimensión de inclusión social tuvo el efecto contrario. Los análisis descriptivos y de regresión revelaron que factores como residir fuera de la ciudad y un alto grado de dependencia influían negativamente en la calidad de vida, mientras que el grado de institucionalización tenía un impacto positivo.
ConclusionesEs importante destacar los efectos positivos del grado de institucionalización sobre la rehabilitación y el bienestar, ya que este busca potenciar la autonomía y la integración social, cuando se habla de modelos de institucionalización centrados en el paciente.
Cerebral palsy is the most common cause of motor disability in pediatric age, with an incidence in Spain and Europe of approximately 2-3 cases per 1000 live births, which in Spain means a population of more than 50,000 people affected (estimated prevalence of 1.36 per 1,000 inhabitants).1 This condition, which has no cure, has a direct impact on health-related quality of life from infancy to old age, considering that the life expectancy of this population in developed countries ranks approximately between 30-70 years.2 Cerebral palsy is associated with various comorbidities, such as sensory, perceptual, cognitive, behavioral, communicative, neurological, and secondary musculoskeletal disorders, which tend to affect quality of life (QoL) with advancing age.3,4
QoL is an important element in the assessment of the health of people with cerebral palsy because of its multidimensional impact on psychosocial function.4 It is an important outcome indicator when evaluating health care interventions and treatments to understand the burden of disease, identify health inequalities, allocate health resources, and conduct epidemiological studies.5,6
Most of the existing research on QoL assessment of cerebral palsy populations is focused on the pediatric population.4,7–9 The studies found assessing the QoL of adults with cerebral palsy are mostly proxy reports, responded by third parties and not by the affected individuals themselves.4,10,11 Many studies also lack of specific QoL related information for adults with cerebral palsy, using generic instead of disease-specific instruments.6 The few available studies in which adults with cerebral palsy self-report their own QoL have consistently shown higher scores, comparable to those of the validation samples of the measurement tools used and similar to those of healthy adults.7,8
Factors associated with this gap in the literature could be explained, at least in part, by the difficulty of correctly assessing the QoL of disabled adults, often considered unreliable respondents.5,12 Nevertheless, there is ample evidence4,7,8,12,13 that people with disabilities still can reliably self-report their QoL, as long as it takes into account the needs of their conditions, and is tailored to their emotional development, cognitive ability, reading and communication levels.9,12,13
The most relevant gaps identified in research on adult cerebral palsy healthcare include: poor transitions in healthcare services, barriers in physical, social and digital accessibility, lack of psychological and social support, discrimination and absence of policies that promote autonomy and economic independence.4,10,14,15 These barriers affect quality of life and well-being. Addressing these deficiencies is crucial to improve research and better understand the quality of life of this population.16,17
Institutionalization of adults with cerebral palsy is a complex issue that is closely related to the multiple barriers faced by these individuals, especially in healthcare.18,19 Studies suggest that the QoL of institutionalized patients may be low, although it varies according to the type of institutionalization, which may be patient-centered or only in the general provision of services (conventional).17,20 However, a significant gap in the literature on the QoL of adults with cerebral palsy lies in the adequate assessment of those residing in institutions. This challenge is due to the need for significant accommodations to allow adults with disabilities to report their own QoL, which may require additional resources.5,12
The aim of this study is to investigate the QoL of a sample of institutionalized adults with cerebral palsy in Navarra, Spain, from the perspective of the patients themselves. The study also identifies clinical, diagnostic, and sociodemographic factors of their self-assessed QoL.
MethodStudy sampleData were obtained from the Study of Adult Cerebral Palsy in Navarra (EPCANA). This cross-sectional study of QoL and clinical and sociodemographic outcomes was conducted at the Spanish Association for the Care of Persons with Cerebral Palsy (Aspace), as part of a comprehensive assessment of QoL, using a disease-specific instrument, the San Martin Scale.
A convenience sample was used, initially composed of 88 institutionalized adults who met the inclusion criteria: adults with any type of cerebral palsy (spastic, dyskinetic, ataxic, and unclassified), classification based on the person's tone and posture,21,22 settled in Navarra, Spain, and who were part of an institution specializing in the care of adults with cerebral palsy, Aspace. The San Martin Scale and the factors and living conditions questionnaire were self-administered in two different years to the same population, between November and December 2021 and in the same period in 2022. Although 88 people were initially considered for the study, only a total of 72 responded to the questionnaire, representing a response rate of 81.81%.
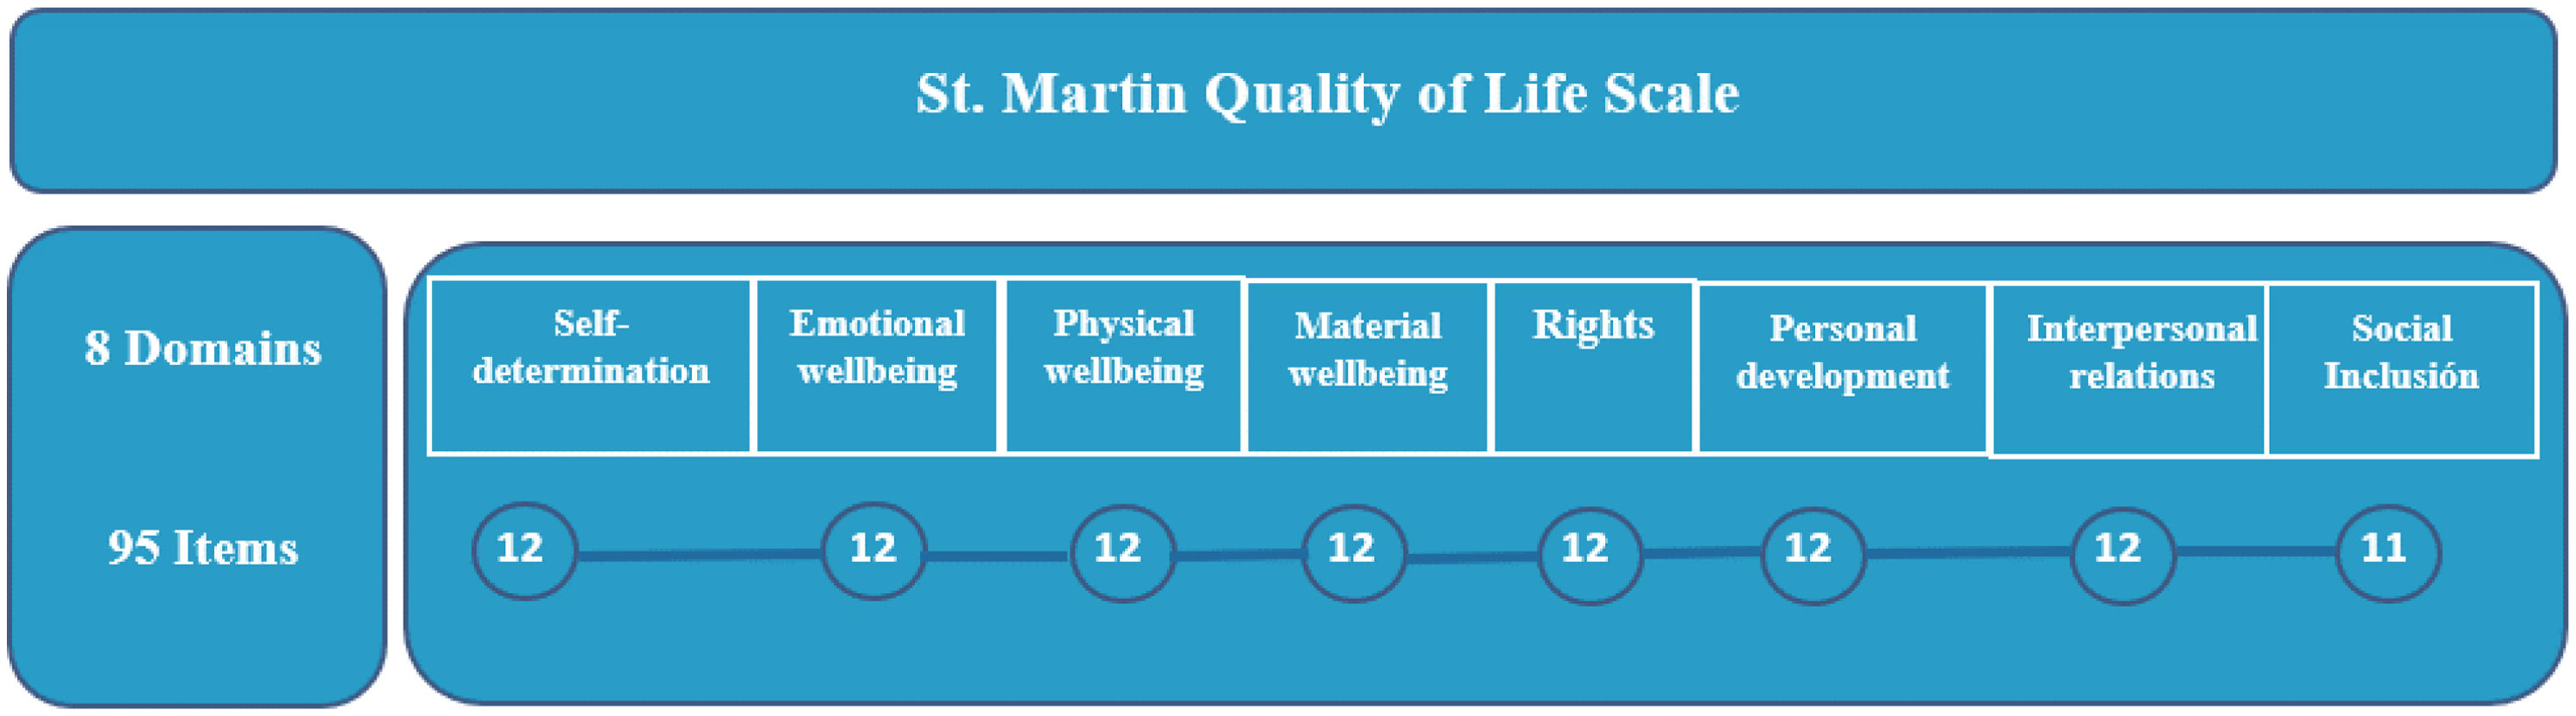
InstrumentThe San Martin QoL Scale23 is based on the multidimensional model of QoL developed by Schalock et al.24 It is the first scale built to assess the QoL of people with significant disabilities and is validated and accepted internationally.23,25 The instrument consists of 95 items, organized around the eight domains of QoL, which include observable aspects and objectives of QoL (see Table S1 in Supplementary material). This scale is adapted to a self-report or proxy report. The respondent is asked to answer the questions with a 4-point Likert-type style: never=1, sometimes=2, often=3 or always=4. Responses from the San Martin Scale are often used to obtain a single QoL value via the Quality of Life Index (QoLI) and this value is reported in clinical studies. The San Martin Scale measures QoL over a range of values from 52 to 132 points.26 A higher score represents a higher QoL on the QoLI. The total score of the San Martin Scale is obtained by measuring QoL in eight dimensions26 (Fig. 1).

Structure of the San Martin Scale, showing the breakdown into eight domains and ninety-five items. The items are related in each dimension. All dimensions have 12 items, except for the social inclusion domain, which has 11 items. Own elaboration, based on the Scale Manual26 (see Supplementary material).
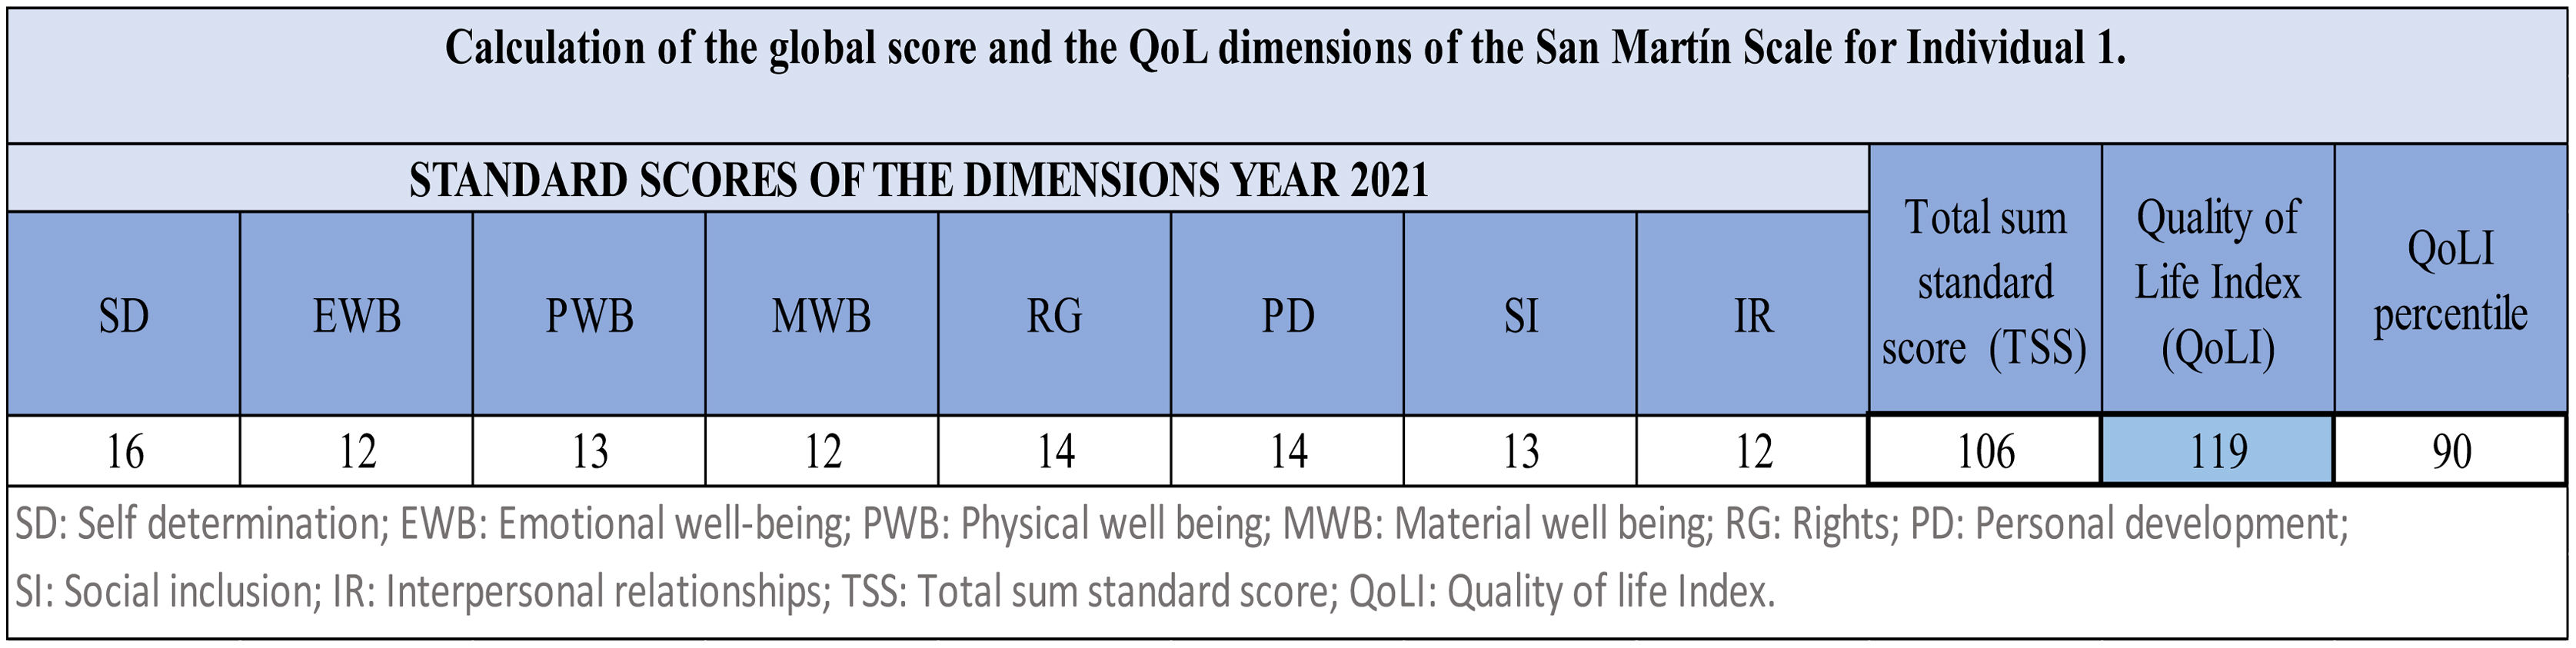
When the San Martin Scale is administered to an individual, the responses that the individual has given per question (item) are obtained. By adding the responses for each item, the total direct scores for each dimension are obtained. Having the total direct scores of the dimensions, these are transformed into standard scores, using Table A in Annex A of the San Martin Scale manual26. Once having the standard scores for each dimension in on are obtained, they are summed up to obtain the total standard score. This total standard score is converted to a QoLI using Table B in Appendix A of the San Martin Scale manual23,26. For example, Figure 2 presents the total standard score sum for the eight dimensions of “106”, then when converted to a QoLI equal to “119”, with a percentile of “90” (see Annexes A-B in Supplementary material).

Example of how to calculate and interpret the San Martin Scale when administered to an individual. Own elaboration, based on the Scale Manual26.
Additionally, other factors and living conditions with some impact on the QoL of individuals with cerebral palsy11,27,28 were evaluated. A complementary questionnaire was designed of nine items: age, sex, place of residence, degree of dependence, percentage of disability, type of cerebral palsy, cerebral palsy-related disorders, length of time with the institution, and type of service enjoyed in the institution (residence, school, occupational center, day center).
Statistical analysisThe main characteristics of the sample were presented by means of a descriptive analysis of all the variables used in the study (sociodemographic, clinical and diagnostic, degree of institutionalization). In addition, the results of the global QoL and by dimensions of the San Martin Scale were obtained, showing the mean QoL of the 72 adults with cerebral palsy and the standard mean scores for each dimension and year. The analysis concludes with the translation of these scores into the respective QoLI, following the San Martín Scale manual.26
The estimation of the relationships between the QoLI and the sociodemographic, clinical, diagnostic, and characteristics corresponding to the degree of institutionalization was performed using the ordinary least squares (OLS) and ordered Logit method. In addition, the relationship between all categories of variables with the overall QoL scores of the sample was estimated. The estimation of the OLS models was based on the stepwise forward method, which was complemented by an analysis of the robustness of the models with goodness-of-fit criteria. In order to carry out the estimation using logit models, the QoLI variable has been categorized into three levels by setting as benchmarks for the scores of the San Martin scale values below 110, between 110 to 119, and 120 or above. The starting point was 110, because it is a value close to the mean reference score in the scale validation population (M=100),25,26,29 to consider a poor QoL below this value and a better QoL above this value. The value of 120 was chosen because it represents the 90th percentile of the scale.26
The OLS and Logit models estimate QoLI, a model-dependent variable representing an individual's QoL in 2021 or 2022. SEX is a dummy variable (1 for male, 0 for female), POR represents residence (1 for main city where Aspace is located, 0 for outside), and AGE indicates the respondent's age in years at survey time.
PDD indicates disability percentage (0% to 100%). DOD1, DOD2 (reference), and DOD3 are dummy variables representing moderate, severe, and high dependence, respectively. Each equal 1 if individual i has that dependency level, 0 otherwise. CPRD is a dummy for cerebral palsy-related disorders (1 for cerebral palsy-related, 0 otherwise). CPT1, CPT2, CPT3, and CPT4 (reference) denote cerebral palsy types: spastic, dyskinetic, ataxic, and unclassified, respectively. They equal 1 if individual i has that cerebral palsy type, 0 otherwise.
Binary variables RSD (residences), OCRS (occupational center and residences), SCRS (school and residences), DCRS (day center and residences), DC (day center), and SC (school, reference category) depict an individual's service utilization in the institution. They are 1 when the service is used and 0 otherwise (individuals can use multiple services simultaneously). The continuous variable Inst is a variable that relates the TVA (time that the individual has been in the institution) with age (specifically calculated as the quotient between TVA and AGE), which is interpreted as the degree of institutionalization of individual i as a function of the time the individual has been in the institution corrected for her age.
Data management was carried out using Microsoft Excel, and R statistical software version 4.3.2 was used for statistical analysis.
Ethical approvalThe EPCANA study protocol and amendments were approved by the Research Ethics Committee of the Public University of Navarra (no. 026/23).
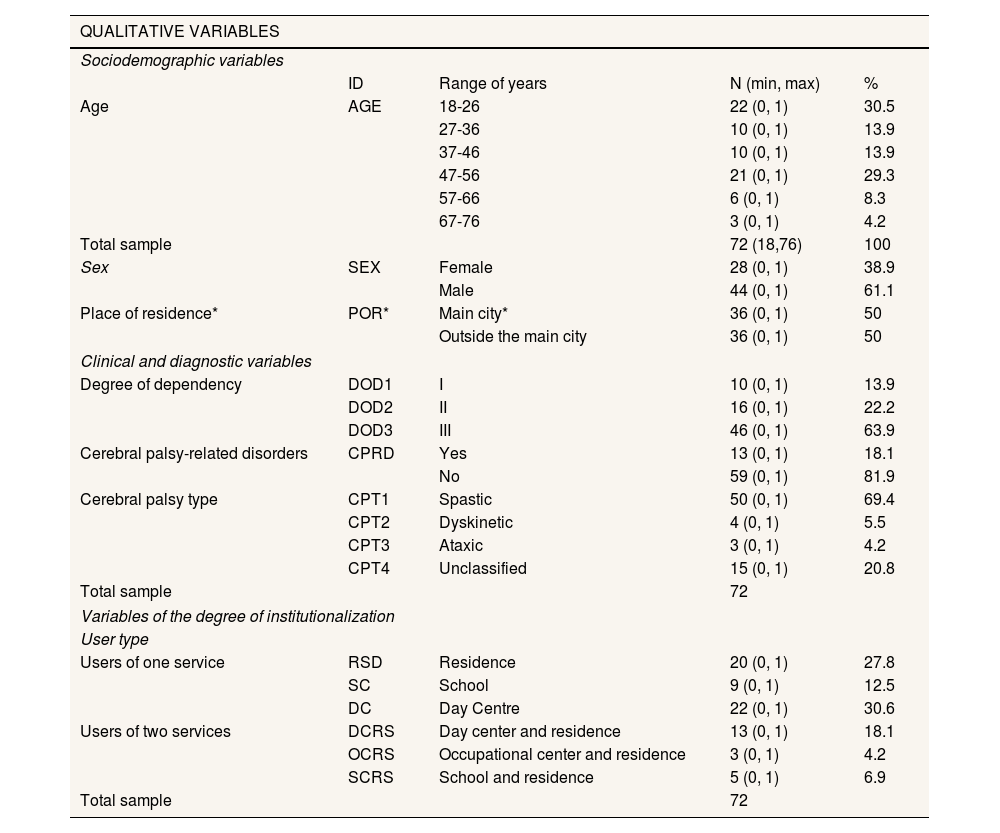
ResultsTable 1 shows the sociodemographic variables of the 72 adults; 61.1% were men. Ages ranged from 18 to 76 years with a mean of 39.25 years. The variable degree of institutionalization regarding the time of adults with disabilities linked to Aspace, the average was 19.5 years of stay, with a minimum of 3 years and a maximum of 45 years.
Characteristics of the sample (n=72).
| QUALITATIVE VARIABLES | ||||
|---|---|---|---|---|
| Sociodemographic variables | ||||
| ID | Range of years | N (min, max) | % | |
| Age | AGE | 18-26 | 22 (0, 1) | 30.5 |
| 27-36 | 10 (0, 1) | 13.9 | ||
| 37-46 | 10 (0, 1) | 13.9 | ||
| 47-56 | 21 (0, 1) | 29.3 | ||
| 57-66 | 6 (0, 1) | 8.3 | ||
| 67-76 | 3 (0, 1) | 4.2 | ||
| Total sample | 72 (18,76) | 100 | ||
| Sex | SEX | Female | 28 (0, 1) | 38.9 |
| Male | 44 (0, 1) | 61.1 | ||
| Place of residence* | POR* | Main city* | 36 (0, 1) | 50 |
| Outside the main city | 36 (0, 1) | 50 | ||
| Clinical and diagnostic variables | ||||
| Degree of dependency | DOD1 | I | 10 (0, 1) | 13.9 |
| DOD2 | II | 16 (0, 1) | 22.2 | |
| DOD3 | III | 46 (0, 1) | 63.9 | |
| Cerebral palsy-related disorders | CPRD | Yes | 13 (0, 1) | 18.1 |
| No | 59 (0, 1) | 81.9 | ||
| Cerebral palsy type | CPT1 | Spastic | 50 (0, 1) | 69.4 |
| CPT2 | Dyskinetic | 4 (0, 1) | 5.5 | |
| CPT3 | Ataxic | 3 (0, 1) | 4.2 | |
| CPT4 | Unclassified | 15 (0, 1) | 20.8 | |
| Total sample | 72 | |||
| Variables of the degree of institutionalization | ||||
| User type | ||||
| Users of one service | RSD | Residence | 20 (0, 1) | 27.8 |
| SC | School | 9 (0, 1) | 12.5 | |
| DC | Day Centre | 22 (0, 1) | 30.6 | |
| Users of two services | DCRS | Day center and residence | 13 (0, 1) | 18.1 |
| OCRS | Occupational center and residence | 3 (0, 1) | 4.2 | |
| SCRS | School and residence | 5 (0, 1) | 6.9 | |
| Total sample | 72 | |||
| QUANTITATIVE VARIABLES | |||||
|---|---|---|---|---|---|
| Variables degree of institutionalization | |||||
| Length of time at Aspace | TVA | Mean | SD | Min | Max |
| 19.57 | 11.00 | 3 | 45 | ||
| Clinical-diagnostic variables | |||||
| Percentage of disability | POD | ||||
| 88.49 | 9.32 | 44 | 100 | ||
| Variables referring to the QoLI 2021/2022 | |||||
| Quality of life Index | QoLI | ||||
| 110.8 / 109.8 | 10.48 / 11.40 | 81 / 82 | 131 / 128 | ||
| Self determination | SD | 12.93 / 12.92 | 2.94 / 2.77 | 5.0 / 7.0 | 17 / 17 |
| Emotional well-being | EWB | 12.06 / 11.82 | 2.22 / 2.30 | 6.0 / 6.0 | 16 / 15 |
| Physical well being | PWB | 12.12 / 11.93 | 1.93 / 1.98 | 7.0 / 7.0 | 15 / 15 |
| Material well being | MWB | 11.78 / 11.58 | 1.93 / 2.05 | 6.0 / 6.0 | 14 / 14 |
| Rights | RG | 12.47 / 12.60 | 1.74 / 1.75 | 8.0 / 6.0 | 15 / 15 |
| Personal development | PD | 11.44 / 11.46 | 2.68 / 2.88 | 5.0 / 5.0 | 15 / 16 |
| Social inclusion | SI | 10.47 / 9.86 | 3.23 / 3.15 | 2.0 / 3.0 | 15 / 15 |
| Interpersonal relationships | IR | 11.18 / 10.88 | 2.36 / 2.63 | 4.0 / 4.0 | 16 / 15 |
Aspace: Spanish Association for the Care of Persons with Cerebral Palsy; Min/Max: minimum/maximum value of variable; POR: place of habitual residence, where you are registered; RSD: residential services specialized in short- or long-term care for adults with cerebral palsy; SD: standard deviation.
Main city: main urban area, capital of the Autonomous Community of Navarra, Pamplona (where Aspace services are located).
The age variable is categorized into ranges similar to the Spanish Survey of Disability, Personal Autonomy, and Dependency Situations21. These align with crucial developmental milestones for adults with cerebral palsy, including the transition from adolescence to early adulthood, middle age, and old age, reflecting changing healthcare needs1,3.
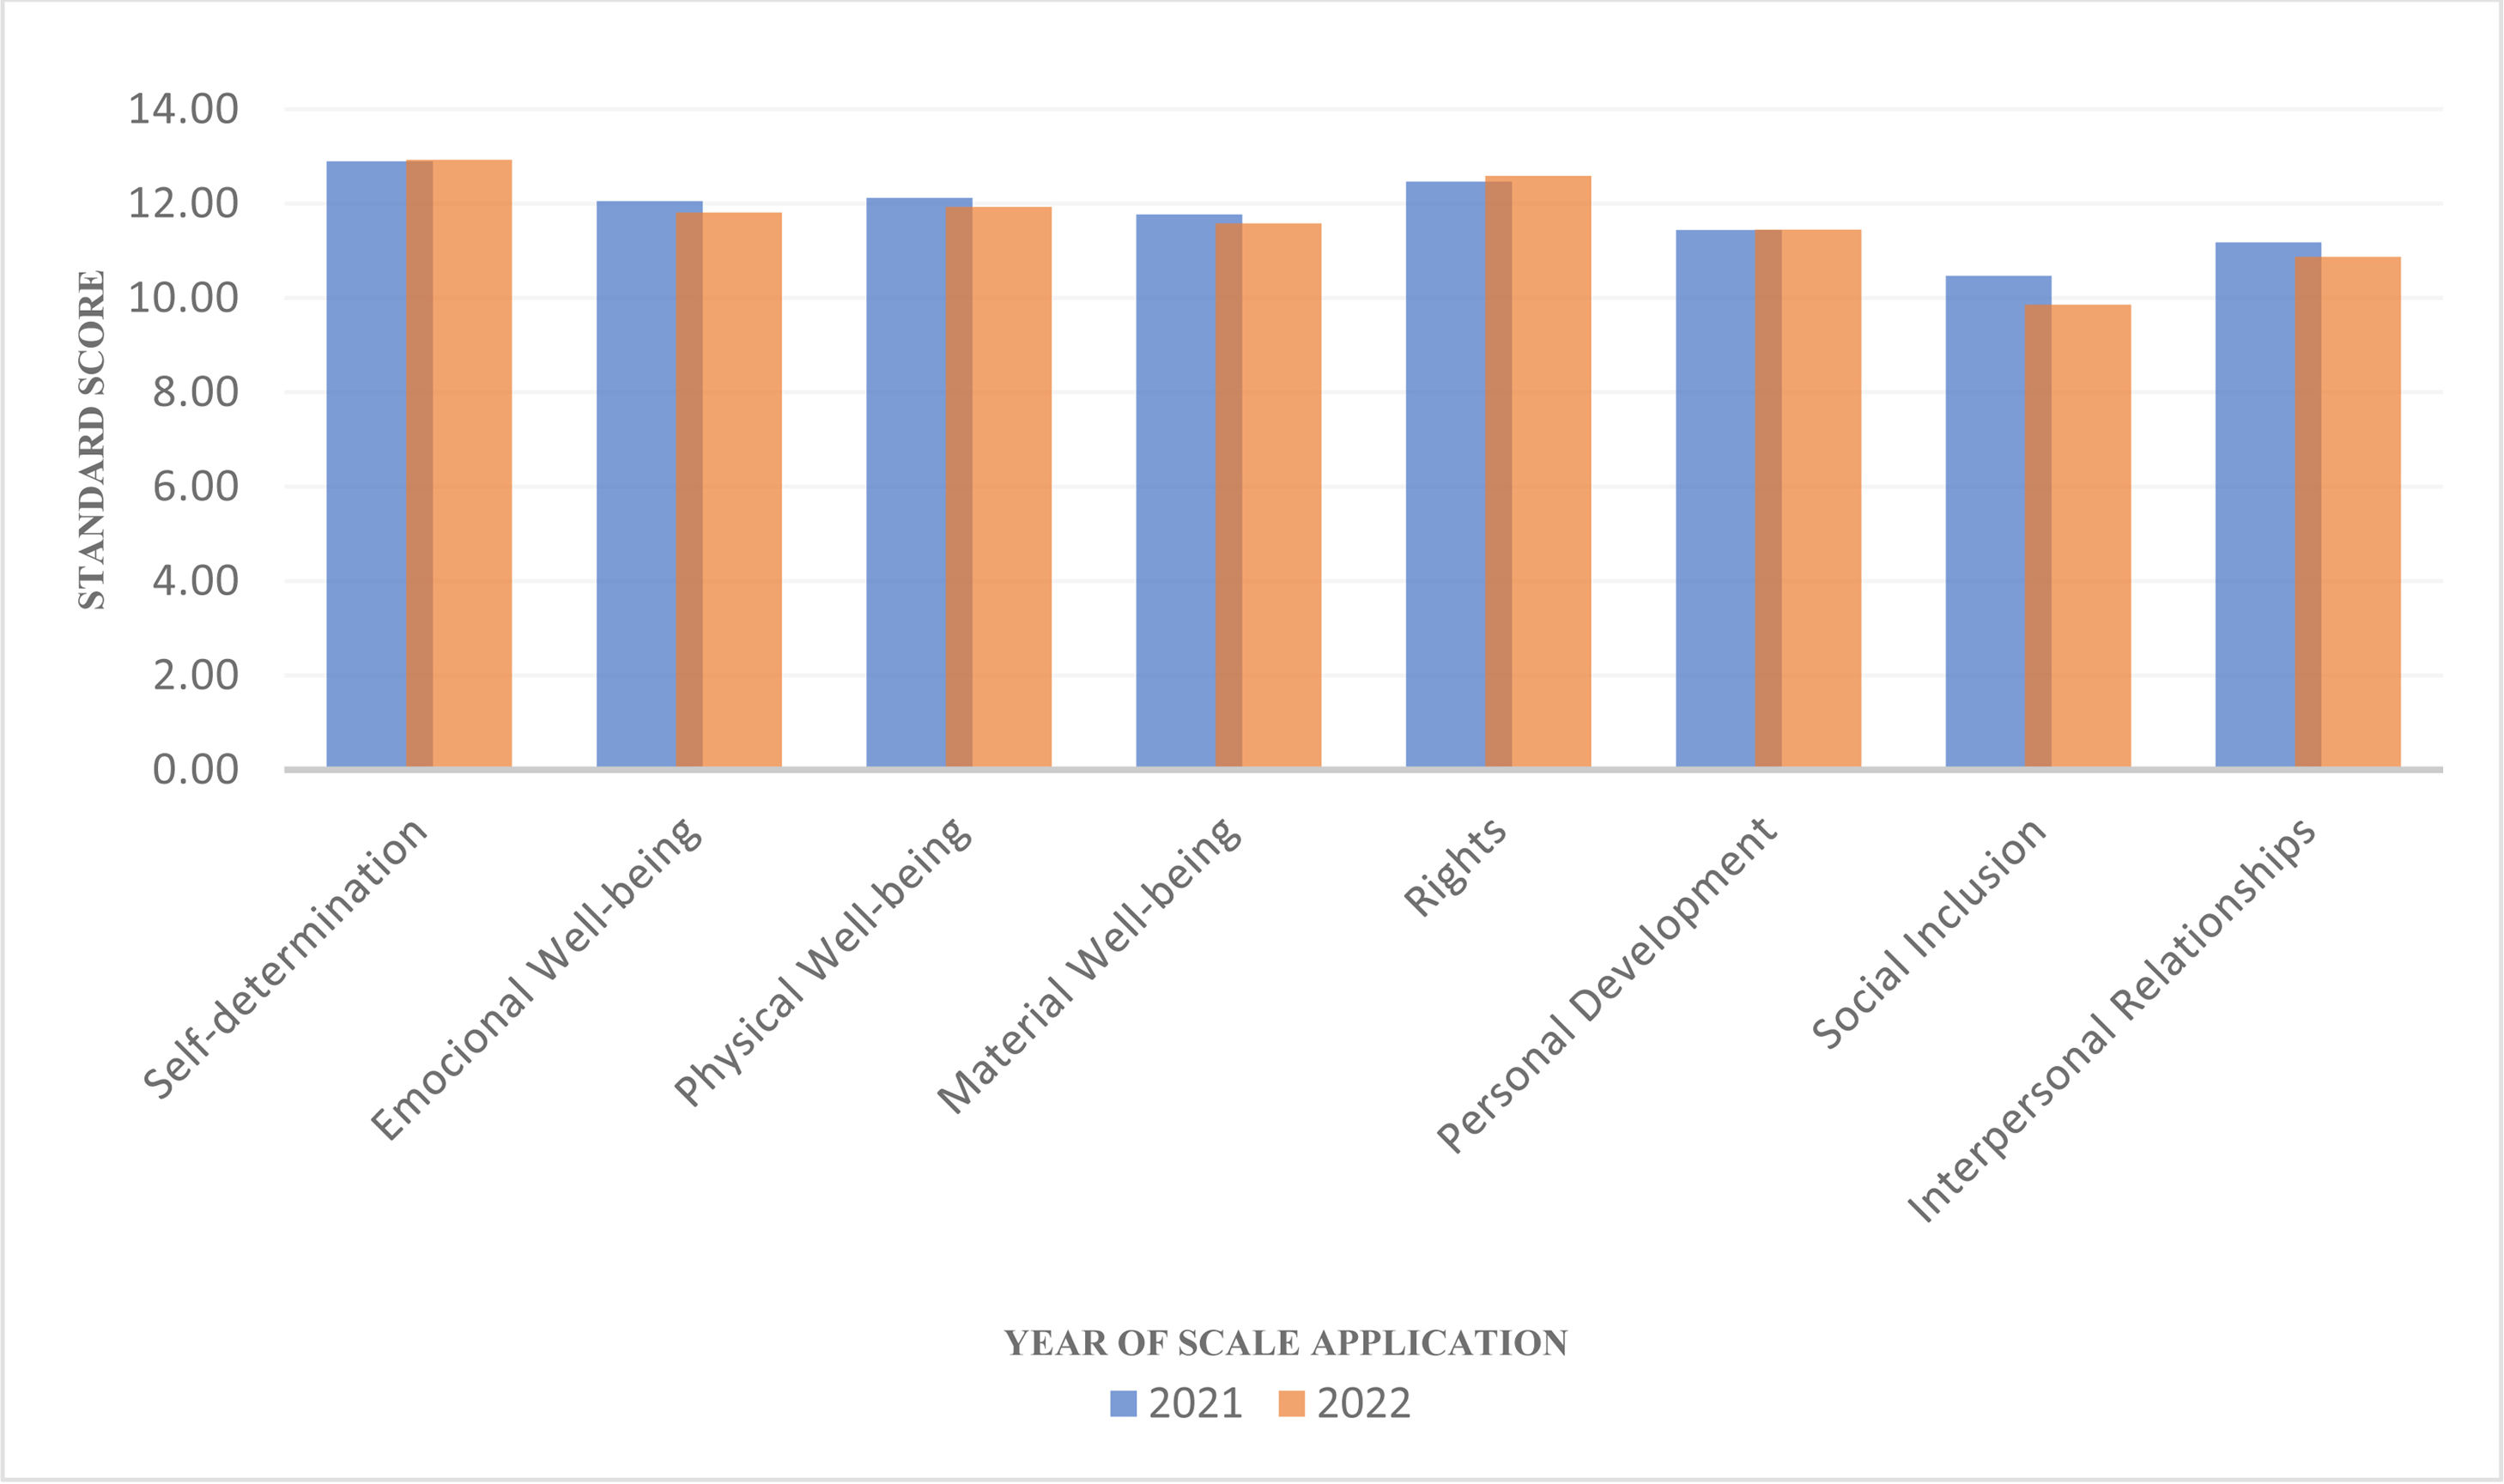
The global mean score obtained for the QoLI indicator of the 72 participants was (mean=110.3; standard deviation [SD]=10.9) over the two years26 (see Figs. S1-S2 and Table S1 in Supplementary material). This indicates that it is a good QoL concerning the mean of the adults with significant disabilities with whom this scale was previously validated (mean=100; SD=15).25,26,29
When analyzing the aggregate data of the eight dimensions that make up the QoLI, it was observed that only one of the dimensions, social inclusion (mean=10.1; SD=3.1) reached the theoretical midpoint of the scale when it was validated (mean=10; SD=3).26,29 Otherwise, all other dimensions were above this mean. The dimension that reached the highest mean score was self-determination (mean=12.92; SD=2.8). These results show that the QoL of the people to whom we administered the San Martin Scale is above the mean obtained by the 1,770 people with significant disabilities who made up the scale's validation sample29 (Fig. 3).
Multivariate regression models
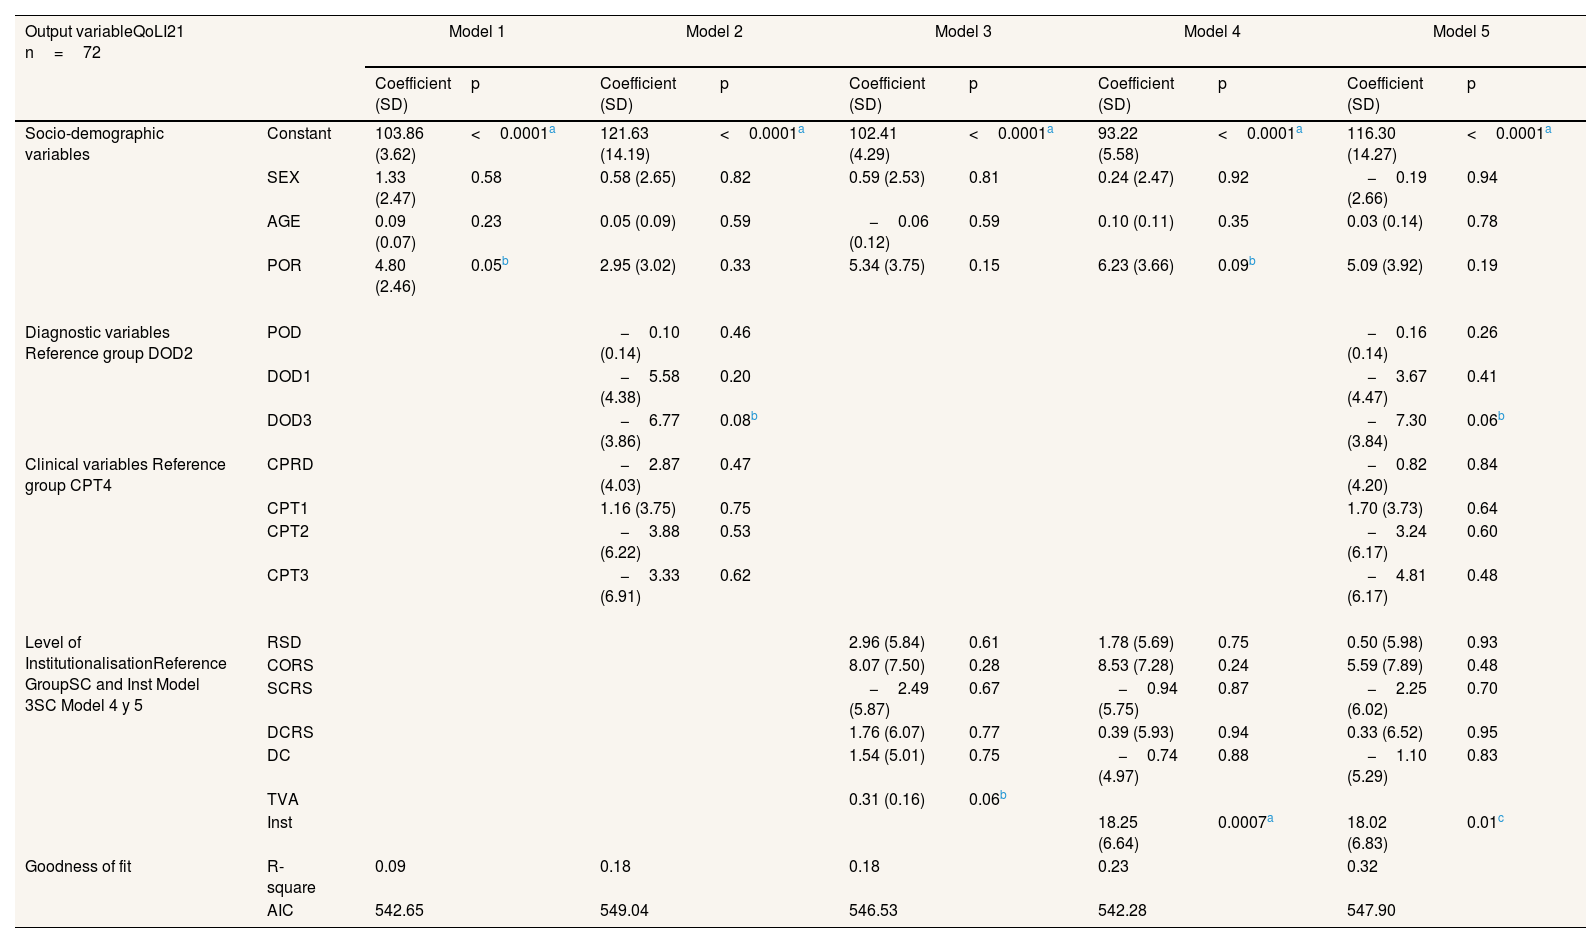
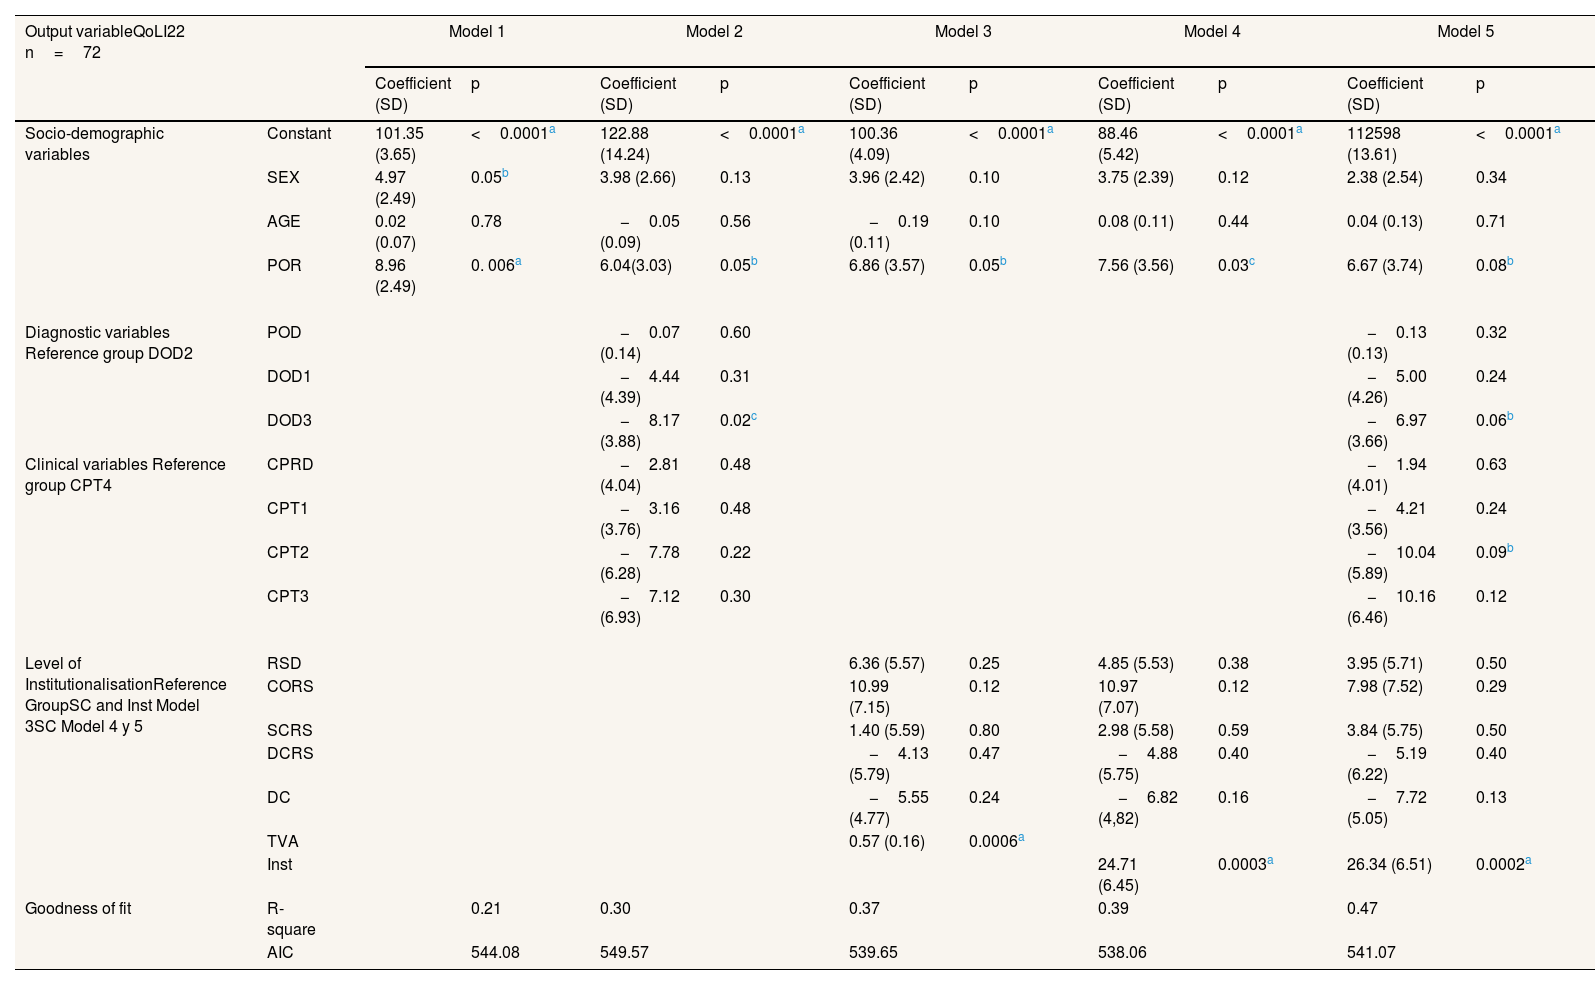
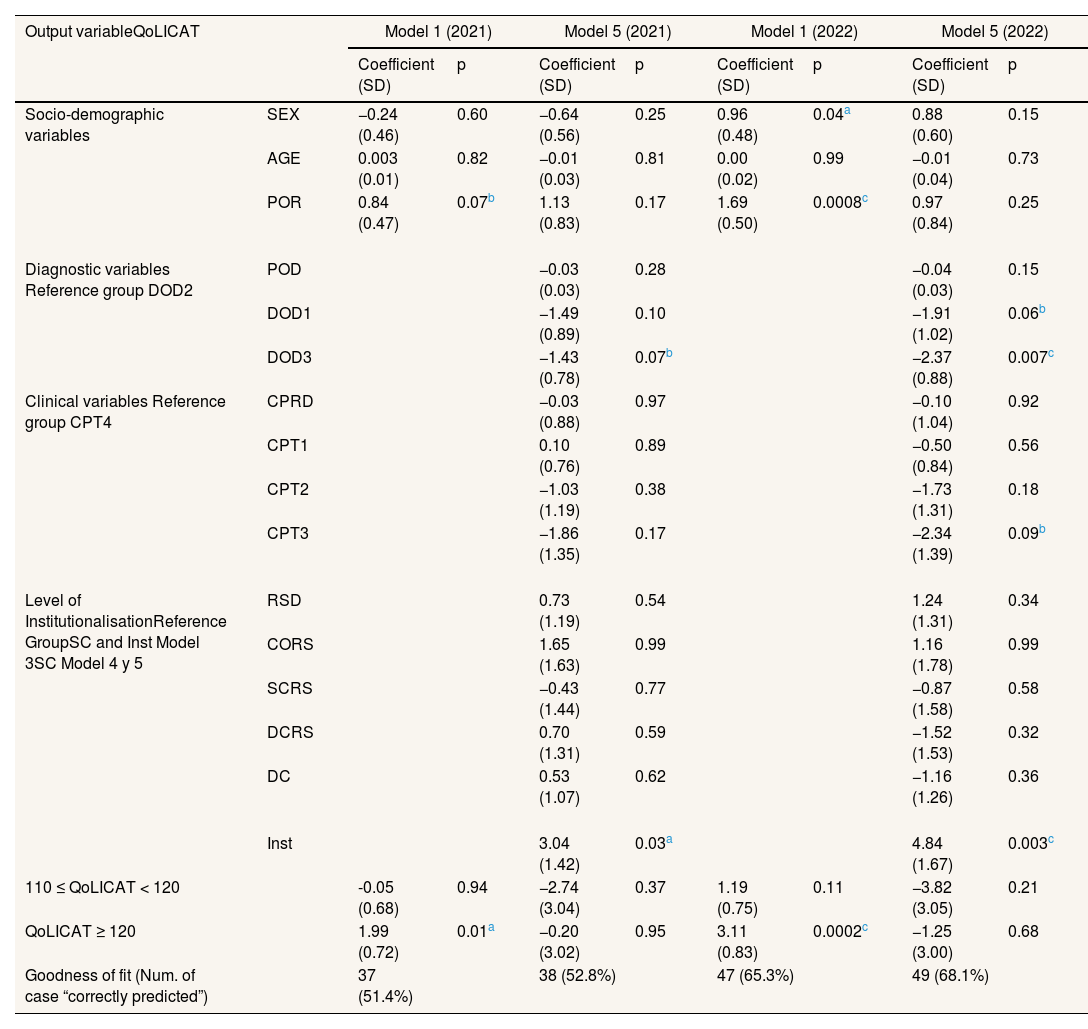
Likewise, to study the possible relationship between the different variables and the dimensions of the San Martin Scale, multivariate models were estimated by year (Tables 2-4). In turn, it was shown that the “degree of institutionalization” was positively related to the dimensions of QoL in the San Martin Scale. It should be noted that the relationships between the different variables included in the models and the QoL of patients generally remain stable, both over the years and across the different estimation methods used in the analysis.
Estimated results by OLS of the multivariate models: quality of life according to sociodemographic, clinical, and diagnostic variables, and the degree of institutionalization, 2021.
| Output variableQoLI21 n=72 | Model 1 | Model 2 | Model 3 | Model 4 | Model 5 | ||||||
|---|---|---|---|---|---|---|---|---|---|---|---|
| Coefficient (SD) | p | Coefficient (SD) | p | Coefficient (SD) | p | Coefficient (SD) | p | Coefficient (SD) | p | ||
| Socio-demographic variables | Constant | 103.86 (3.62) | <0.0001a | 121.63 (14.19) | <0.0001a | 102.41 (4.29) | <0.0001a | 93.22 (5.58) | <0.0001a | 116.30 (14.27) | <0.0001a |
| SEX | 1.33 (2.47) | 0.58 | 0.58 (2.65) | 0.82 | 0.59 (2.53) | 0.81 | 0.24 (2.47) | 0.92 | −0.19 (2.66) | 0.94 | |
| AGE | 0.09 (0.07) | 0.23 | 0.05 (0.09) | 0.59 | −0.06 (0.12) | 0.59 | 0.10 (0.11) | 0.35 | 0.03 (0.14) | 0.78 | |
| POR | 4.80 (2.46) | 0.05b | 2.95 (3.02) | 0.33 | 5.34 (3.75) | 0.15 | 6.23 (3.66) | 0.09b | 5.09 (3.92) | 0.19 | |
| Diagnostic variables Reference group DOD2 | POD | −0.10 (0.14) | 0.46 | −0.16 (0.14) | 0.26 | ||||||
| DOD1 | −5.58 (4.38) | 0.20 | −3.67 (4.47) | 0.41 | |||||||
| DOD3 | −6.77 (3.86) | 0.08b | −7.30 (3.84) | 0.06b | |||||||
| Clinical variables Reference group CPT4 | CPRD | −2.87 (4.03) | 0.47 | −0.82 (4.20) | 0.84 | ||||||
| CPT1 | 1.16 (3.75) | 0.75 | 1.70 (3.73) | 0.64 | |||||||
| CPT2 | −3.88 (6.22) | 0.53 | −3.24 (6.17) | 0.60 | |||||||
| CPT3 | −3.33 (6.91) | 0.62 | −4.81 (6.17) | 0.48 | |||||||
| Level of InstitutionalisationReference GroupSC and Inst Model 3SC Model 4 y 5 | RSD | 2.96 (5.84) | 0.61 | 1.78 (5.69) | 0.75 | 0.50 (5.98) | 0.93 | ||||
| CORS | 8.07 (7.50) | 0.28 | 8.53 (7.28) | 0.24 | 5.59 (7.89) | 0.48 | |||||
| SCRS | −2.49 (5.87) | 0.67 | −0.94 (5.75) | 0.87 | −2.25 (6.02) | 0.70 | |||||
| DCRS | 1.76 (6.07) | 0.77 | 0.39 (5.93) | 0.94 | 0.33 (6.52) | 0.95 | |||||
| DC | 1.54 (5.01) | 0.75 | −0.74 (4.97) | 0.88 | −1.10 (5.29) | 0.83 | |||||
| TVA | 0.31 (0.16) | 0.06b | |||||||||
| Inst | 18.25 (6.64) | 0.0007a | 18.02 (6.83) | 0.01c | |||||||
| Goodness of fit | R-square | 0.09 | 0.18 | 0.18 | 0.23 | 0.32 | |||||
| AIC | 542.65 | 549.04 | 546.53 | 542.28 | 547.90 | ||||||
AGE: age; AIC: Akaike's information criterion; CPRD: cerebral palsy related disorders; CPT1: spastic cerebral palsy; CPT2: dyskinetic cerebral palsy; CPT3: ataxic cerebral palsy; CPT4: unclassified cerebral palsy; DC: day care center; DCRS: day and residential care centers; DOD1: moderate degree of dependency; DOD2: severe degree of dependency; DOD3: degree of high dependency; Inst: TVA/AGE (institutionalisation level); OCRS: occupational center and residential homes; POD: porcentage of disability; POR: place of residence; QoLI21: Quality of Life Index; RSD: residential homes; SC: school; SCRS: school and residential homes; SD: standar deviation; SEX: sex; TVA: length of time in the institution.
Estimated results by OLS of the multivariate models: quality of life according to sociodemographic, clinical, and diagnostic variables, and the degree of institutionalization, 2022.
| Output variableQoLI22 n=72 | Model 1 | Model 2 | Model 3 | Model 4 | Model 5 | ||||||
|---|---|---|---|---|---|---|---|---|---|---|---|
| Coefficient (SD) | p | Coefficient (SD) | p | Coefficient (SD) | p | Coefficient (SD) | p | Coefficient (SD) | p | ||
| Socio-demographic variables | Constant | 101.35 (3.65) | <0.0001a | 122.88 (14.24) | <0.0001a | 100.36 (4.09) | <0.0001a | 88.46 (5.42) | <0.0001a | 112598 (13.61) | <0.0001a |
| SEX | 4.97 (2.49) | 0.05b | 3.98 (2.66) | 0.13 | 3.96 (2.42) | 0.10 | 3.75 (2.39) | 0.12 | 2.38 (2.54) | 0.34 | |
| AGE | 0.02 (0.07) | 0.78 | −0.05 (0.09) | 0.56 | −0.19 (0.11) | 0.10 | 0.08 (0.11) | 0.44 | 0.04 (0.13) | 0.71 | |
| POR | 8.96 (2.49) | 0. 006a | 6.04(3.03) | 0.05b | 6.86 (3.57) | 0.05b | 7.56 (3.56) | 0.03c | 6.67 (3.74) | 0.08b | |
| Diagnostic variables Reference group DOD2 | POD | −0.07 (0.14) | 0.60 | −0.13 (0.13) | 0.32 | ||||||
| DOD1 | −4.44 (4.39) | 0.31 | −5.00 (4.26) | 0.24 | |||||||
| DOD3 | −8.17 (3.88) | 0.02c | −6.97 (3.66) | 0.06b | |||||||
| Clinical variables Reference group CPT4 | CPRD | −2.81 (4.04) | 0.48 | −1.94 (4.01) | 0.63 | ||||||
| CPT1 | −3.16 (3.76) | 0.48 | −4.21 (3.56) | 0.24 | |||||||
| CPT2 | −7.78 (6.28) | 0.22 | −10.04 (5.89) | 0.09b | |||||||
| CPT3 | −7.12 (6.93) | 0.30 | −10.16 (6.46) | 0.12 | |||||||
| Level of InstitutionalisationReference GroupSC and Inst Model 3SC Model 4 y 5 | RSD | 6.36 (5.57) | 0.25 | 4.85 (5.53) | 0.38 | 3.95 (5.71) | 0.50 | ||||
| CORS | 10.99 (7.15) | 0.12 | 10.97 (7.07) | 0.12 | 7.98 (7.52) | 0.29 | |||||
| SCRS | 1.40 (5.59) | 0.80 | 2.98 (5.58) | 0.59 | 3.84 (5.75) | 0.50 | |||||
| DCRS | −4.13 (5.79) | 0.47 | −4.88 (5.75) | 0.40 | −5.19 (6.22) | 0.40 | |||||
| DC | −5.55 (4.77) | 0.24 | −6.82 (4,82) | 0.16 | −7.72 (5.05) | 0.13 | |||||
| TVA | 0.57 (0.16) | 0.0006a | |||||||||
| Inst | 24.71 (6.45) | 0.0003a | 26.34 (6.51) | 0.0002a | |||||||
| Goodness of fit | R-square | 0.21 | 0.30 | 0.37 | 0.39 | 0.47 | |||||
| AIC | 544.08 | 549.57 | 539.65 | 538.06 | 541.07 | ||||||
AGE: age; AIC: Akaike's information criterion; CPRD: cerebral palsy related disorders; CPT1: spastic cerebral palsy; CPT2: dyskinetic cerebral palsy; CPT3: ataxic cerebral palsy; CPT4: unclassified cerebral palsy; DC: day care center; DCRS: day and residential care centers; DOD1: moderate degree of dependency; DOD2: severe degree of dependency; DOD3: degree of high dependency; Inst: TVA/AGE (institutionalisation level); OCRS: occupational center and residential homes; POD: porcentage of disability; POR: place of residence; QoLI22: Quality of Life Index; RSD: residential homes; SC: school; SCRS: school and residential homes; SD: standar deviation; SEX: sex; TVA: length of time in the institution.
Estimated results by ordered logit of the multivariate models: quality of life according to sociodemographic, clinical, and diagnostic variables, and the degree of institutionalization (n=72).
| Output variableQoLICAT | Model 1 (2021) | Model 5 (2021) | Model 1 (2022) | Model 5 (2022) | |||||
|---|---|---|---|---|---|---|---|---|---|
| Coefficient (SD) | p | Coefficient (SD) | p | Coefficient (SD) | p | Coefficient (SD) | p | ||
| Socio-demographic variables | SEX | −0.24 (0.46) | 0.60 | −0.64 (0.56) | 0.25 | 0.96 (0.48) | 0.04a | 0.88 (0.60) | 0.15 |
| AGE | 0.003 (0.01) | 0.82 | −0.01 (0.03) | 0.81 | 0.00 (0.02) | 0.99 | −0.01 (0.04) | 0.73 | |
| POR | 0.84 (0.47) | 0.07b | 1.13 (0.83) | 0.17 | 1.69 (0.50) | 0.0008c | 0.97 (0.84) | 0.25 | |
| Diagnostic variables Reference group DOD2 | POD | −0.03 (0.03) | 0.28 | −0.04 (0.03) | 0.15 | ||||
| DOD1 | −1.49 (0.89) | 0.10 | −1.91 (1.02) | 0.06b | |||||
| DOD3 | −1.43 (0.78) | 0.07b | −2.37 (0.88) | 0.007c | |||||
| Clinical variables Reference group CPT4 | CPRD | −0.03 (0.88) | 0.97 | −0.10 (1.04) | 0.92 | ||||
| CPT1 | 0.10 (0.76) | 0.89 | −0.50 (0.84) | 0.56 | |||||
| CPT2 | −1.03 (1.19) | 0.38 | −1.73 (1.31) | 0.18 | |||||
| CPT3 | −1.86 (1.35) | 0.17 | −2.34 (1.39) | 0.09b | |||||
| Level of InstitutionalisationReference GroupSC and Inst Model 3SC Model 4 y 5 | RSD | 0.73 (1.19) | 0.54 | 1.24 (1.31) | 0.34 | ||||
| CORS | 1.65 (1.63) | 0.99 | 1.16 (1.78) | 0.99 | |||||
| SCRS | −0.43 (1.44) | 0.77 | −0.87 (1.58) | 0.58 | |||||
| DCRS | 0.70 (1.31) | 0.59 | −1.52 (1.53) | 0.32 | |||||
| DC | 0.53 (1.07) | 0.62 | −1.16 (1.26) | 0.36 | |||||
| Inst | 3.04 (1.42) | 0.03a | 4.84 (1.67) | 0.003c | |||||
| 110 ≤ QoLICAT < 120 | -0.05 (0.68) | 0.94 | −2.74 (3.04) | 0.37 | 1.19 (0.75) | 0.11 | −3.82 (3.05) | 0.21 | |
| QoLICAT ≥ 120 | 1.99 (0.72) | 0.01a | −0.20 (3.02) | 0.95 | 3.11 (0.83) | 0.0002c | −1.25 (3.00) | 0.68 | |
| Goodness of fit (Num. of case “correctly predicted”) | 37 (51.4%) | 38 (52.8%) | 47 (65.3%) | 49 (68.1%) | |||||
AGE: age; AIC: Akaike's information criterion; CPRD: cerebral palsy related disorders; CPT1: spastic cerebral palsy; CPT2: dyskinetic cerebral palsy; CPT3: ataxic cerebral palsy; CPT4: unclassified cerebral palsy; DC: day care center; DCRS: day and residential care centers; DOD1: moderate degree of dependency; DOD2: severe degree of dependency; DOD3: degree of high dependency; Inst: TVA/AGE (institutionalisation level); OCRS: occupational center and residential homes; POD: porcentage of disability; POR: place of residence; QoLICAT: Quality of Life Index categorized; RSD: residential homes; SC: school; SCRS: school and residential homes; SD: standar deviation; SEX: sex; TVA: length of time in the institution.
Model 1 emphasized the impact of socio-demographic variables, revealing that residing in the main city showed a strong positive association with QoL in both years, with significant p-values (p <0.1 in 2021 and p <0.05 in 2022). This remains the case for the year 2022 in the estimation using ordered Logit. Furthermore, in 2022, sex emerged as a significant factor, with males in urban settings showing higher QoL scores in the OLS estimation in 2022 (p <0.1) and in the Logit estimation in 2022 (p <0.05). Model 2 extended the analysis to include clinical and diagnostic variables, highlighting a significant negative relationship between high dependency and QoL (p <0.1 in 2021 and p <0.05 in 2022), while residing within the city was positively associated with QoL in 2022 (p <0.1).
Models 3 and 4 investigate QoL in the context of socio-demographic factors and degree of institutionalization, revealing significant associations between duration of institutionalization, city residence, and degree of institutionalization, with p <0.1 in 2021 and p <0.01 in 2022. Finally, model 5, which encompassed all the study variables, identified high dependency as a factor reducing QoL (p <0.1) and higher institutionalization as a factor increasing QoL (p <0.05).
In all models, whether linear or Logit regression, the variable representing the degree of institutionalization (Inst) emerged as significant. As institutionalization increased, so did the QoLI scores. Similarly, the POR variable was significant in most multivariate models, particularly for individuals who resided outside the main city and commuted daily to receive services, resulting in lower QoL scores due to mobility barriers. Another significant variable was the degree of dependency; as dependency increased, QoL decreased significantly.
DiscussionThere are few studies are measuring self-reported QoL in adults with cerebral palsy,7,8 as most of them focus on pediatric populations.4 Currently, we have found in the international context, only one study on self-reported QoL by Swedish adults with cerebral palsy (n=408),8 where the relationship of QoL with demographic and disability-specific factors was also studied. The study discovered high QoL among Swedish adults with cerebral palsy, despite associations between lower QoL and severe pain and decreased functioning. These results fit with ours, showing high self-reported QoL scores among adults with cerebral palsy in comparison to the San Martin's Scale validation population. In addition, lower QoL scores in our study were also associated with higher levels of dependency, which is related to lower functional capacity.8
On the other hand, in the Spanish context we have only found one study on self-assessed QoL in adults with cerebral palsy institutionalized in Aspace in two Spanish regions (Asturias and Castilla y León; n=75) that also used the San Martin Scale, previously known as the GENCAT Scale (mean=103.29).7 Among their findings, it stands out that one of the most important dimensions of QoL in adults with cerebral palsy is self-determination since it implies the willingness to take control of one's own opportunities and decisions, promoting the possibility of achieving a better QoL.30,31 This finding fits with our results, as the dimension with the highest mean score in our study was self-determination, which may be related to high QoL scores, with respect to adults with other significant disabilities.7,29
In addition, another study was found at the Spanish level, although on a proxy assessment of QoL with the San Martín Scale (mean=102.9) in institutionalized adults with cerebral palsy (n=39) in Aspace in the Valencian community.18 These two studies were developed in Spain7,18 address the assessment of QoL in adults with cerebral palsy and its relationship with institutionalization, focusing on interpersonal relationships, participation and environmental conditions that are possible through institutionalization.7,18 However, we have not found evidence on the positive or negative relationship of the institutionalization factor, in terms of time with respect to the QoL of these adults.
In the literature, it is common that the degree of institutionalization has a negative impact on QoL,17,19,20 because it directly affects the autonomy and independence of the institutionalized person and impairs their participation, as well as physical and social aspects.19,20 However, our study has found a positive relationship between the degree of institutionalization and its interaction with the other predictor variables versus QoL. It might be because we are using a disease-specific QoL instrument, which is more sensitive to the impact of institutionalization degree on QoL dimensions.6 Generic QoL measures may struggle to capture this, due to their insensitivity to such specific pathologies and failure to address crucial aspects of QoL, such as well-being.17,19 In addition, our study refers to a type of institutionalization centered on the patient's needs,12,17,20,21 meaning that individual preferences and needs are prioritized, recognizing disability as a characteristic, improving QoL through community participation and decision-making.16,28,32 This is in contrast to conventional institutionalization models where services are general and not personalized, and where policy-making is centralized in the institution and there is limited participation of the users.19,33
Limitations and strengthsOne of the main limitations of this study is the size of our sample. This represents a low statistical power in our statistical analysis. For this reason, our study is exploratory, so our results and conclusions should be confirmed in future research with larger samples. Our results should be considered in the context of this specific sample and may not be easily generalizable to other conditions. In addition, a possible overrepresentation of adults with grade III dependence and spastic cerebral palsy should be considered.
An important strength of our study is the assessment of self-perceived QoL in adults with cerebral palsy, a topic that has so far been little explored. Furthermore, in our study, we have used a specific instrument, in contrast to the predominant focus on younger populations and generic assessment tools in existing research. These findings are important for future research on QoL among the adult cerebral palsy population to evaluate rehabilitation interventions based on institutional settings.
ConclusionsTo our knowledge, this study is one of the first to investigate self-perceived QoL in institutionalized adults with cerebral palsy. Few similar studies have been found in the Spanish and international context. The results show that institutionalized adults with cerebral palsy in our sample perceived their QoL better compared to adults with other significant disabilities. Self-determination was a positive factor; the results indicate that self-determination significantly impacts the QoL of adults with cerebral palsy, particularly in institutional contexts with developmental dynamics. Social inclusion had a negative impact on QoL scores. Patient-centered institutionalization was related to better QoL, suggesting the importance of policies that promote effective inclusion in institutions specialized in the care and treatment of adults with cerebral palsy, providing opportunities for self-development and improving well-being and health, which today are apparently not possible in the public health system due to the lack of adequate transition of care services to cerebral palsy.
Availability of databases and material for replicationThe database and any materials necessary for replication will be made accessible upon formal request to Aspace Navarra, facilitated through the corresponding author. As this involves sensitive patient data, appropriate consent must be obtained prior to data dissemination.
Previous research has found little evidence studying quality of life in adults with cerebral palsy. This constitutes an evidence gap in the field of economic evaluation, at one of the most challenging and costly stages of this disease, as life expectancy in this population is increasing.
What does this study add to the literature?In contrast to the predominant literature on institutionalization and its typically negative correlation with quality of life, our findings reveal that increased institutionalization positively influenced quality of life, emphasizing the importance of patient-centered models of institutional care. However, this needs to be tested with large samples.
What are the implications of the results?This underscores the importance of tailored interventions based on quality of life outcomes through economic evaluation to improve the quality of life of institutionalized persons with cerebral palsy. Understand the various factors in their environment.
David Cantarero.
Transparency declarationThe corresponding author on behalf of the other authors guarantee the accuracy, transparency and honesty of the data and information contained in the study, that no relevant information has been omitted and that all discrepancies between authors have been adequately resolved and described.
Authorship contributionsD.M. Nova Díaz: design and conceptualisation, investigation, writing-original draft, methodology, acquisition, curation, analysis and interpretation of data, software, formal analysis, writing-critical review and editing. M. Errea Rodríguez: conceptualisation, methodology, data interpretation, writing-critical review and editing, formal analysis. J. Cabasés Hita: conceptualisation, methodology, writing-critical revision and editing. E. Sánchez Iriso: design and conceptualisation, methodology, data analysis and interpretation, writing-critical review and editing, supervision.
AcknowledgmentsThe authors would like to thank all the healthcare professionals from Aspace Navarra who participated in this study for their collaboration with the data collection and interviews, and all the patients and family members who voluntarily participated in this study. In addition, the authors especially thank Ana Pombo (Quality Director) of the Aspace rehabilitation centers for providing the data. Finally, the authors would like to thank Andrés Yesid Calderón (Economist and Consultant at Inter-American Development Bank) for reviewing the statistical analyses in this study.
FundingThe main author has a pre-doctoral grant from the Public University of Navarra (UPNA) and Banco Santander. In addition, the main author has been awarded the SESPAS grant for publication in Gaceta Sanitaria.
Conflict of interestNone.


