


The 3rd International Nursing and Health Sciences Students and Health Care Professionals Conference (INHSP)
More infoThis study aimed to map pregnant women with high-risk pregnancies based on age, parity, pregnancy history, childbirth history, illness history, and CED status history as well as the relationship between the six factors.
MethodThis study utilized a survey method with descriptive data without the intervention of variables but observed phenomena or sought the relationship between phenomena and other variables. The survey was conducted with an approach using Geographic Information Systems (GIS). There were 243 respondents obtained using the Lemeshow formula, while the data were analyzed using spatial techniques and Chi-Square test with p>0.05.
ResultsThe results of spatial analysis using a 1: 50,000 scale map showed that; (1) high-risk and very high-risk pregnancies dominated Talise, (2) based on age, parity, pregnancy history, childbirth history, illness history, and CED status, cases of high-risk pregnancies were all detected in Talise, (3) age (p=0.000). Furthermore, pregnancy history (p=0.004) correlated with a high-risk pregnancy. Besides, parity, childbirth history, illness history, and CED status did not correlate with high-risk pregnancy since the p-value>0.05; (4) age and pregnancy history influenced the high-risk pregnancy.
The Sustainable Development Goals (SDGs) target is a global consensus, one of which is to improve maternal health by reducing the Maternal Mortality Rate (MMR) to below 70 per 100,000 live births by 2030. In 2017, MMR in Central Sulawesi was 166 per 100,000 live births, while in 2018, it decreased to 153 per 100,000 live births.
In 2016, the MMR in Palu City was 159 per 100,000 live births. In its development, every pregnancy has a risk of complications.1 Although complications can also occur in pregnant women who are not categorized at risk, complications tend to increase in pregnant women with risk factors. Without proper and adequate treatment, it is estimated that 15% of pregnancies will experience high-risk conditions and obstetric complications that can endanger mothers or fetuses.2
Early detection of high-risk pregnancy can be done using Poedji Rochjati Score Card (PRSC). PRSC covers several risk factors including age, parity, interpregnancy intervals, Chronic Energy Deficiency (CED) status, anemia, height less than 145cm, medical history, pregnancy history, puerperium, and childbirth history. PRSC is a tool for early detection of a high-risk pregnancy by using scoring. The number of pregnancy scores is divided into three groups: Low-Risk Pregnancy (LRP) with a total score of 2, High-Risk Pregnancy (HRP) with a total score of 6–10, and Very High-Risk Pregnancy (VHRP) with a total score of 12.
The scores used are round numbers below 10, including 2, 4, 8. The original score of a pregnant woman is two, and each risk factor has a score of 4 except for a history of cesarean section, breech position, latitude, antepartum hemorrhage, severe preeclampsia, and eclampsia.3 Furthermore, PRSC will be combined with several other factors such as environmental sanitation, socio-economic conditions of pregnant women, ownership of health insurance cards, and affordability of health service facilities.
Good environmental sanitation for pregnant women affects psychosocial.4 In addition, Geographical Information System (GIS) is a computer-based information system for storing, managing and analyzing, and calling on geographic reference data that has developed rapidly in the last five years.5 Data to be processed in GIS is spatial data; that is a geographically oriented data and a location that has a specific coordinate system, as the basis for its reference.
GIS application can answer several questions such as location, conditions, trends, patterns, and modeling.6 This capability distinguishes GIS from other information systems. The purpose of the Geographic Information System (GIS) is to help decision-making based on the interests and objectives of this study with the aim of providing a geometrical or spatial map to find out the thematic maps of mothers with very high-risk pregnancy.7
Research methodsType, location and period of researchThis research was an observational study. It was conducted by using a survey method without any intervention on the variables, so the data collected were only related to the phenomenon or the relationship between the phenomenon and other variables. Additionally, the survey was conducted using Geographic Information System (GIS) software. To get direct information, interviews and questionnaires were conducted with selected respondents.
Population and sampleThe population in this study were all pregnant women, totaling 659 pregnant women, who performed antenatal services in the Work Area of Talise Health Center, Palu City. There were 243 samples obtained from the total population using the Lemeshow formula.
Sampling in this study was conducted using the Proportionate Stratified Random Sampling method. However, this study only conducted in-depth interviews with 50 pregnant women whose gestational age entered the second trimester.
Data collection techniqueData were collected through questionnaire guidelines by giving a number of questions and taking the coordinates (Longitude and Latitude) of pregnant women collected directly. These coordinate data were used in determining the location of pregnant women (respondents), especially those who took part in in-depth interviews.
Data analysisData were analyzed using spatial analysis or analysis using Geographic Information Systems. Spatial analysis was done by creating a buffer around points, lines, and areas (polygons) and overlaying the map from which the final map was obtained that had adequate information sources as needed.
ResultsCharacteristics of respondentsCharacteristics of respondents in this study included age, parity, pregnancy history, childbirth history, illness history, and CED status.
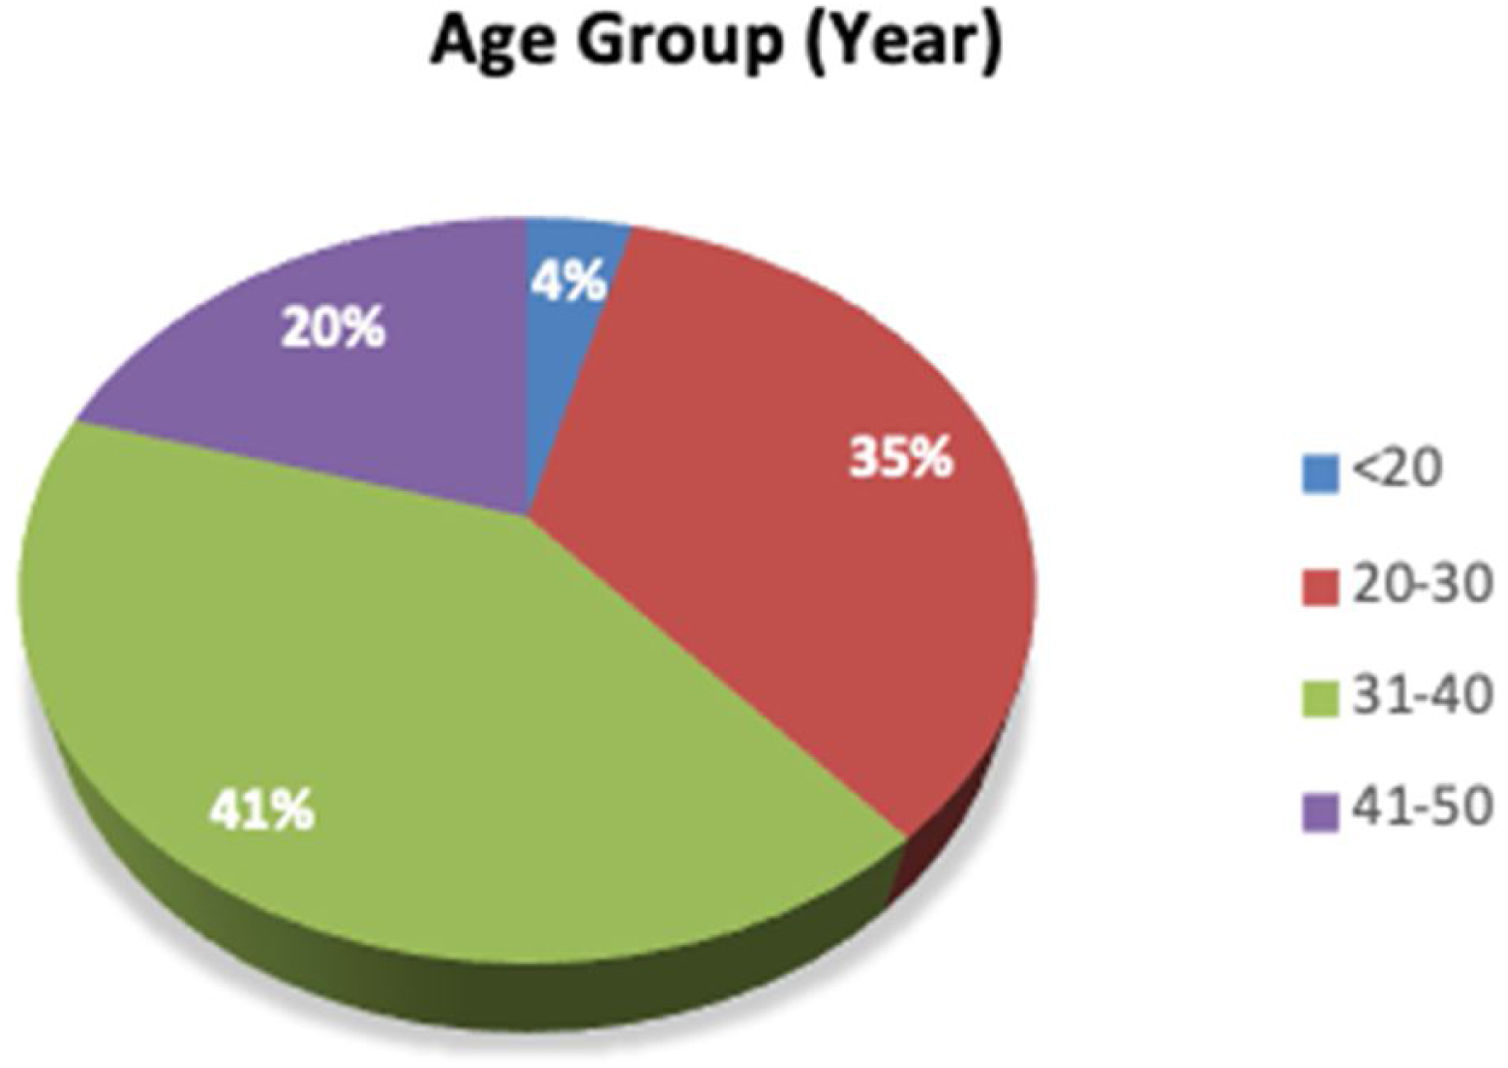
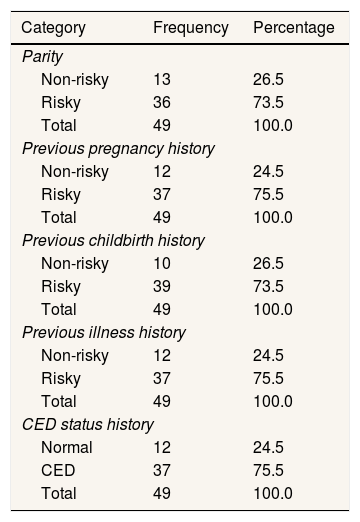
Fig. 1 shows that pregnant women aged 31–41 years dominated Talise Health Center, Palu City. Based on parity, 73% of respondents had children at risk. Additionally, based on previous pregnancy history, 75.5% were at risk; based on previous childbirth history, 73.5% were at risk; based on previous illness history, 75.55% were at risk, and based on CED Status History, 75.5% were at risk. While, distribution of respondents based on parity, pregnancy history, childbirth history, illness history, and CED status can be seen in Table 1.

Distribution of respondents based on parity, pregnancy history, childbirth history, illness history, and CED status.
| Category | Frequency | Percentage |
|---|---|---|
| Parity | ||
| Non-risky | 13 | 26.5 |
| Risky | 36 | 73.5 |
| Total | 49 | 100.0 |
| Previous pregnancy history | ||
| Non-risky | 12 | 24.5 |
| Risky | 37 | 75.5 |
| Total | 49 | 100.0 |
| Previous childbirth history | ||
| Non-risky | 10 | 26.5 |
| Risky | 39 | 73.5 |
| Total | 49 | 100.0 |
| Previous illness history | ||
| Non-risky | 12 | 24.5 |
| Risky | 37 | 75.5 |
| Total | 49 | 100.0 |
| CED status history | ||
| Normal | 12 | 24.5 |
| CED | 37 | 75.5 |
| Total | 49 | 100.0 |
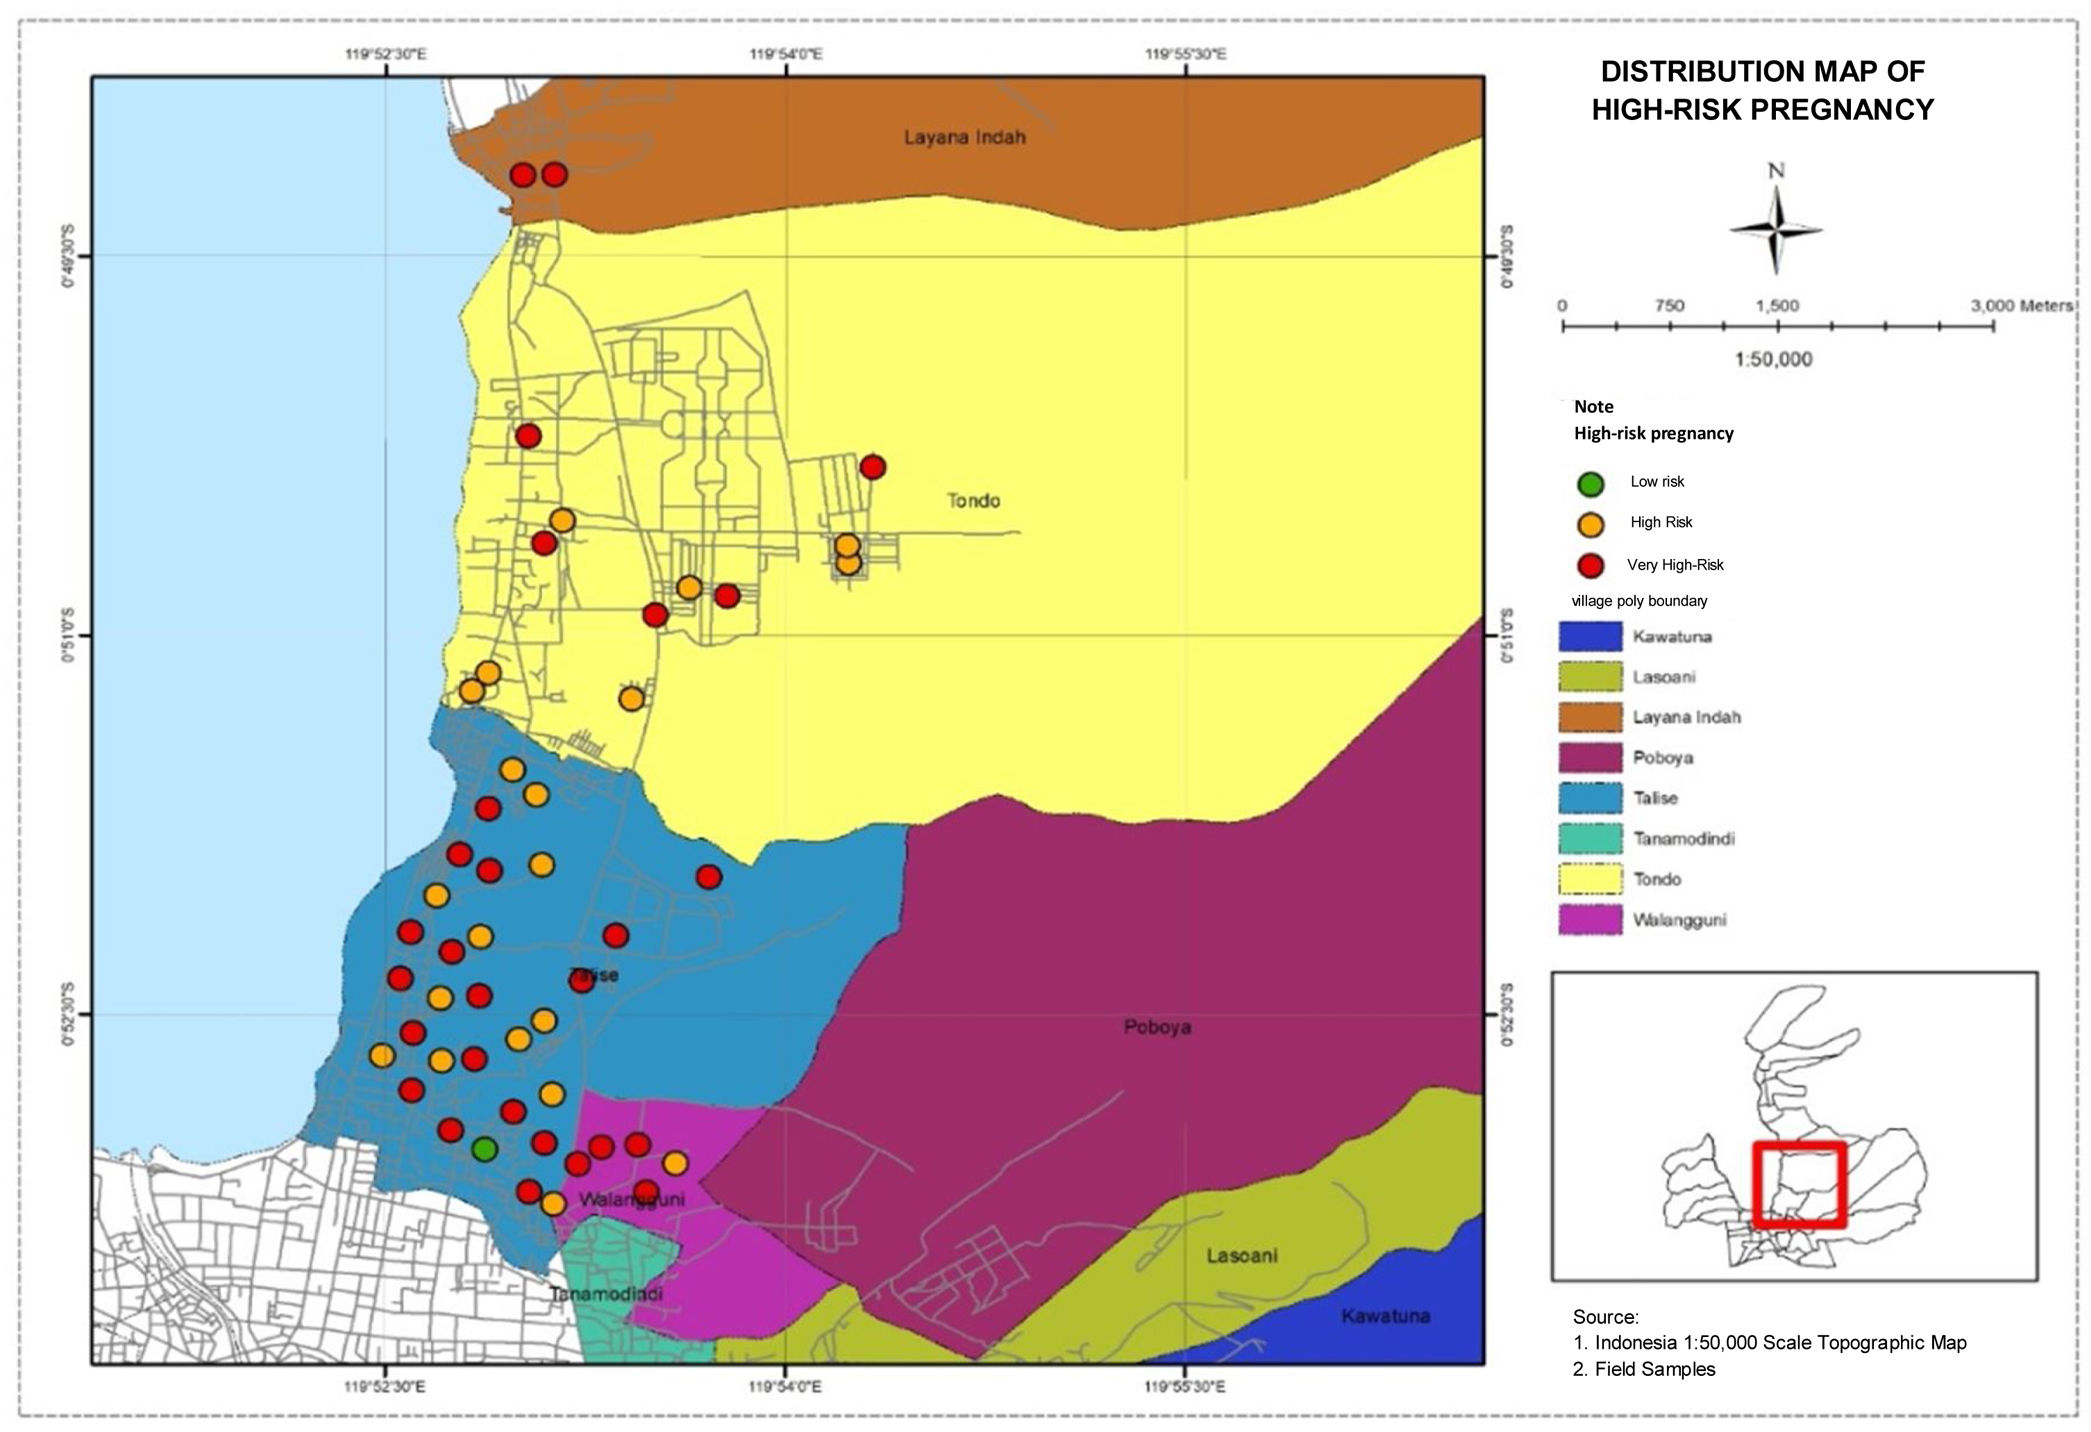
The distribution map of pregnant women below is based on high-risk pregnancy in four villages in Talise Health Center, Palu City. Based on this distribution, very high-risk and high-risk pregnancies were in Talise, can be seen in Fig. 2.
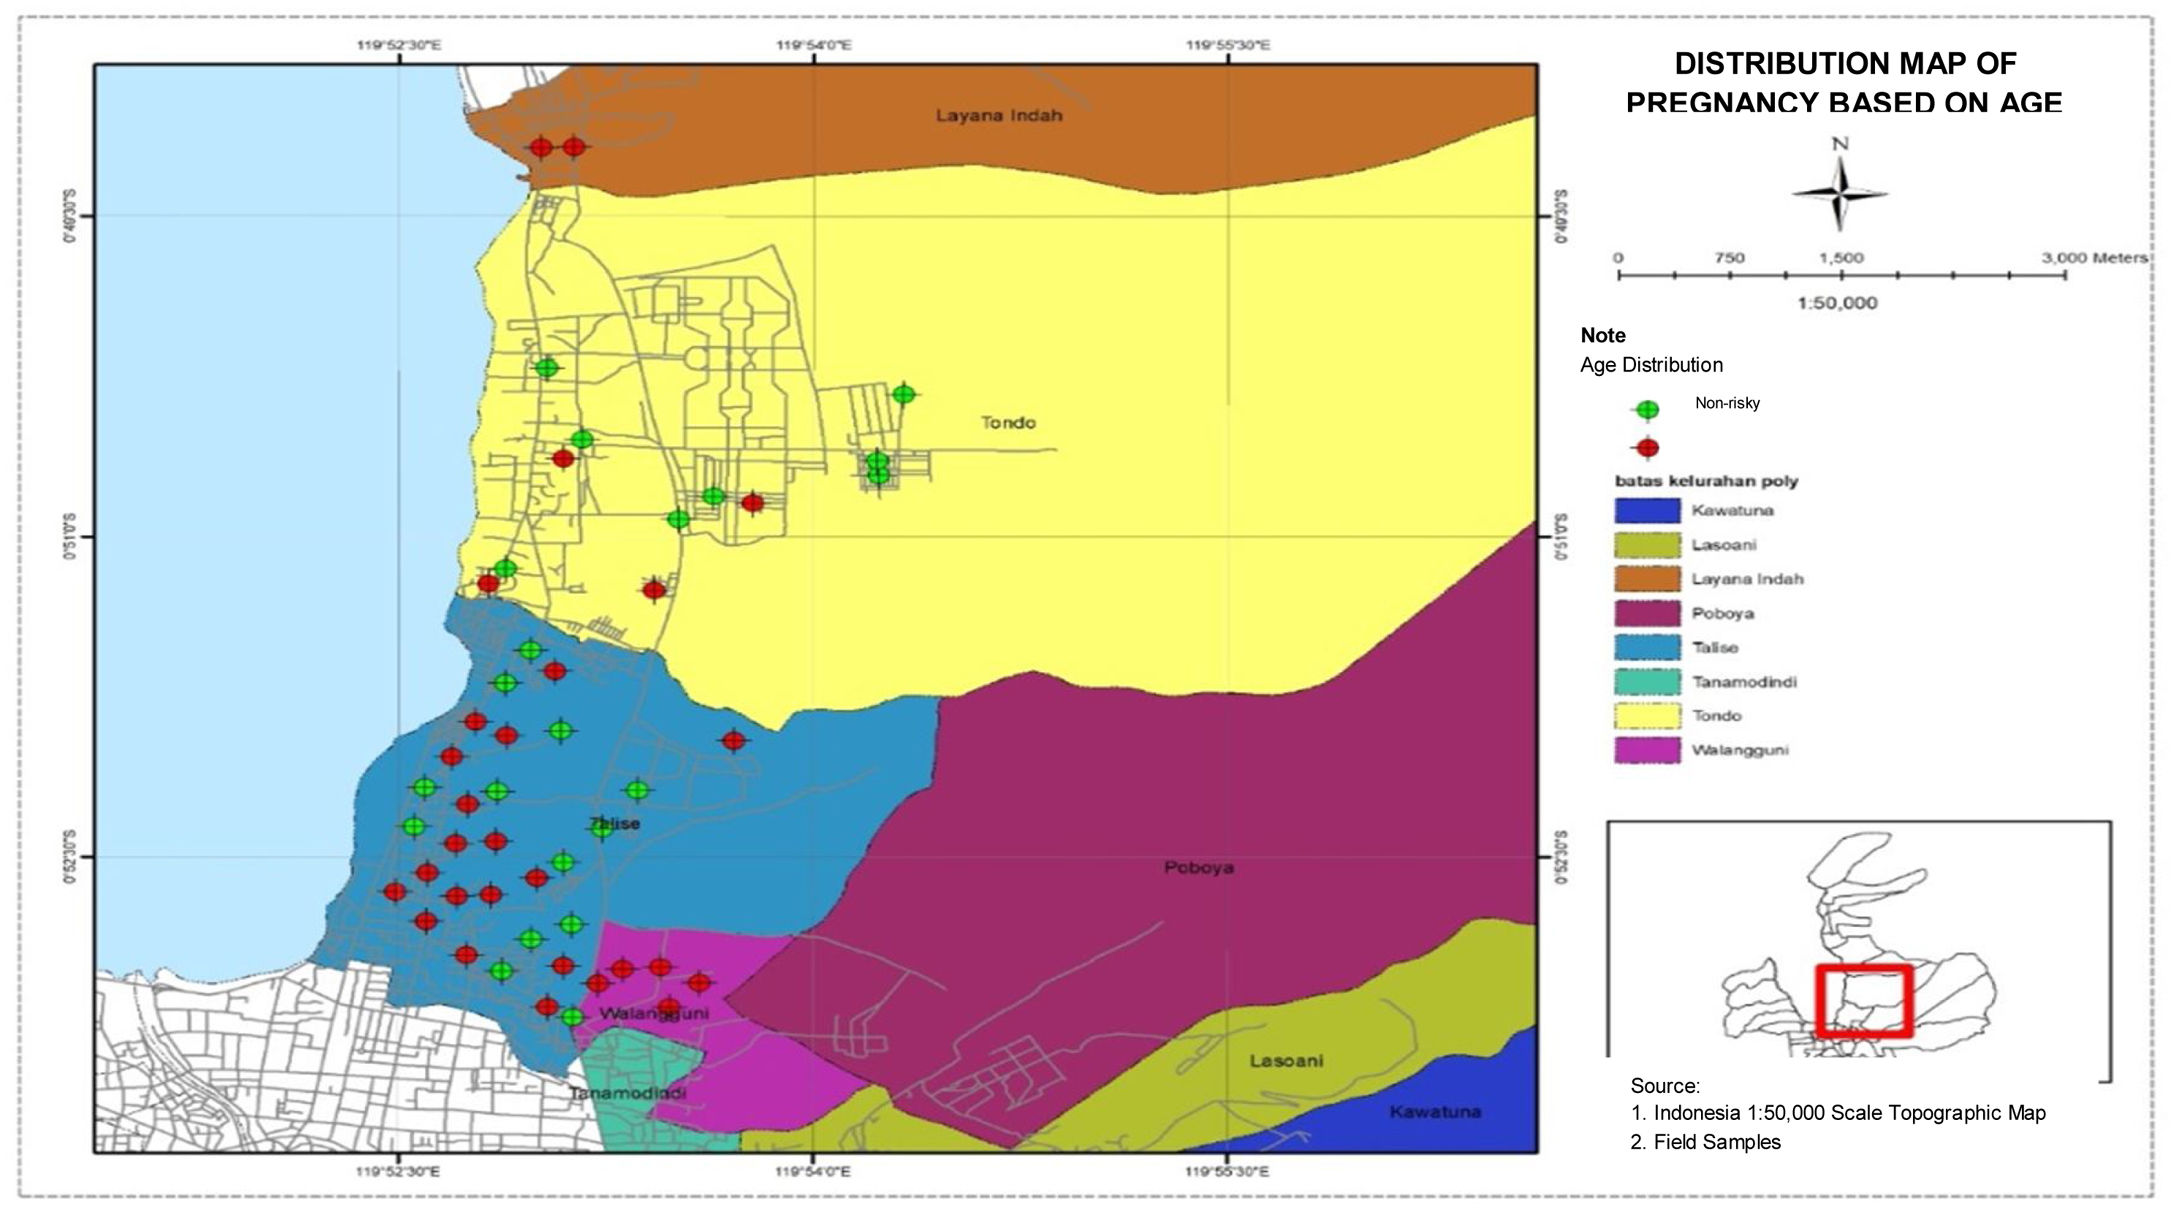
Distribution map of pregnant women based on age
The distribution map of pregnant women based on age is presented in Fig. 3. The figure shows that the highest number of women who had risks during pregnancy were found in Talise, while the lowest number of women who had risks during pregnancy was found in Tondo.
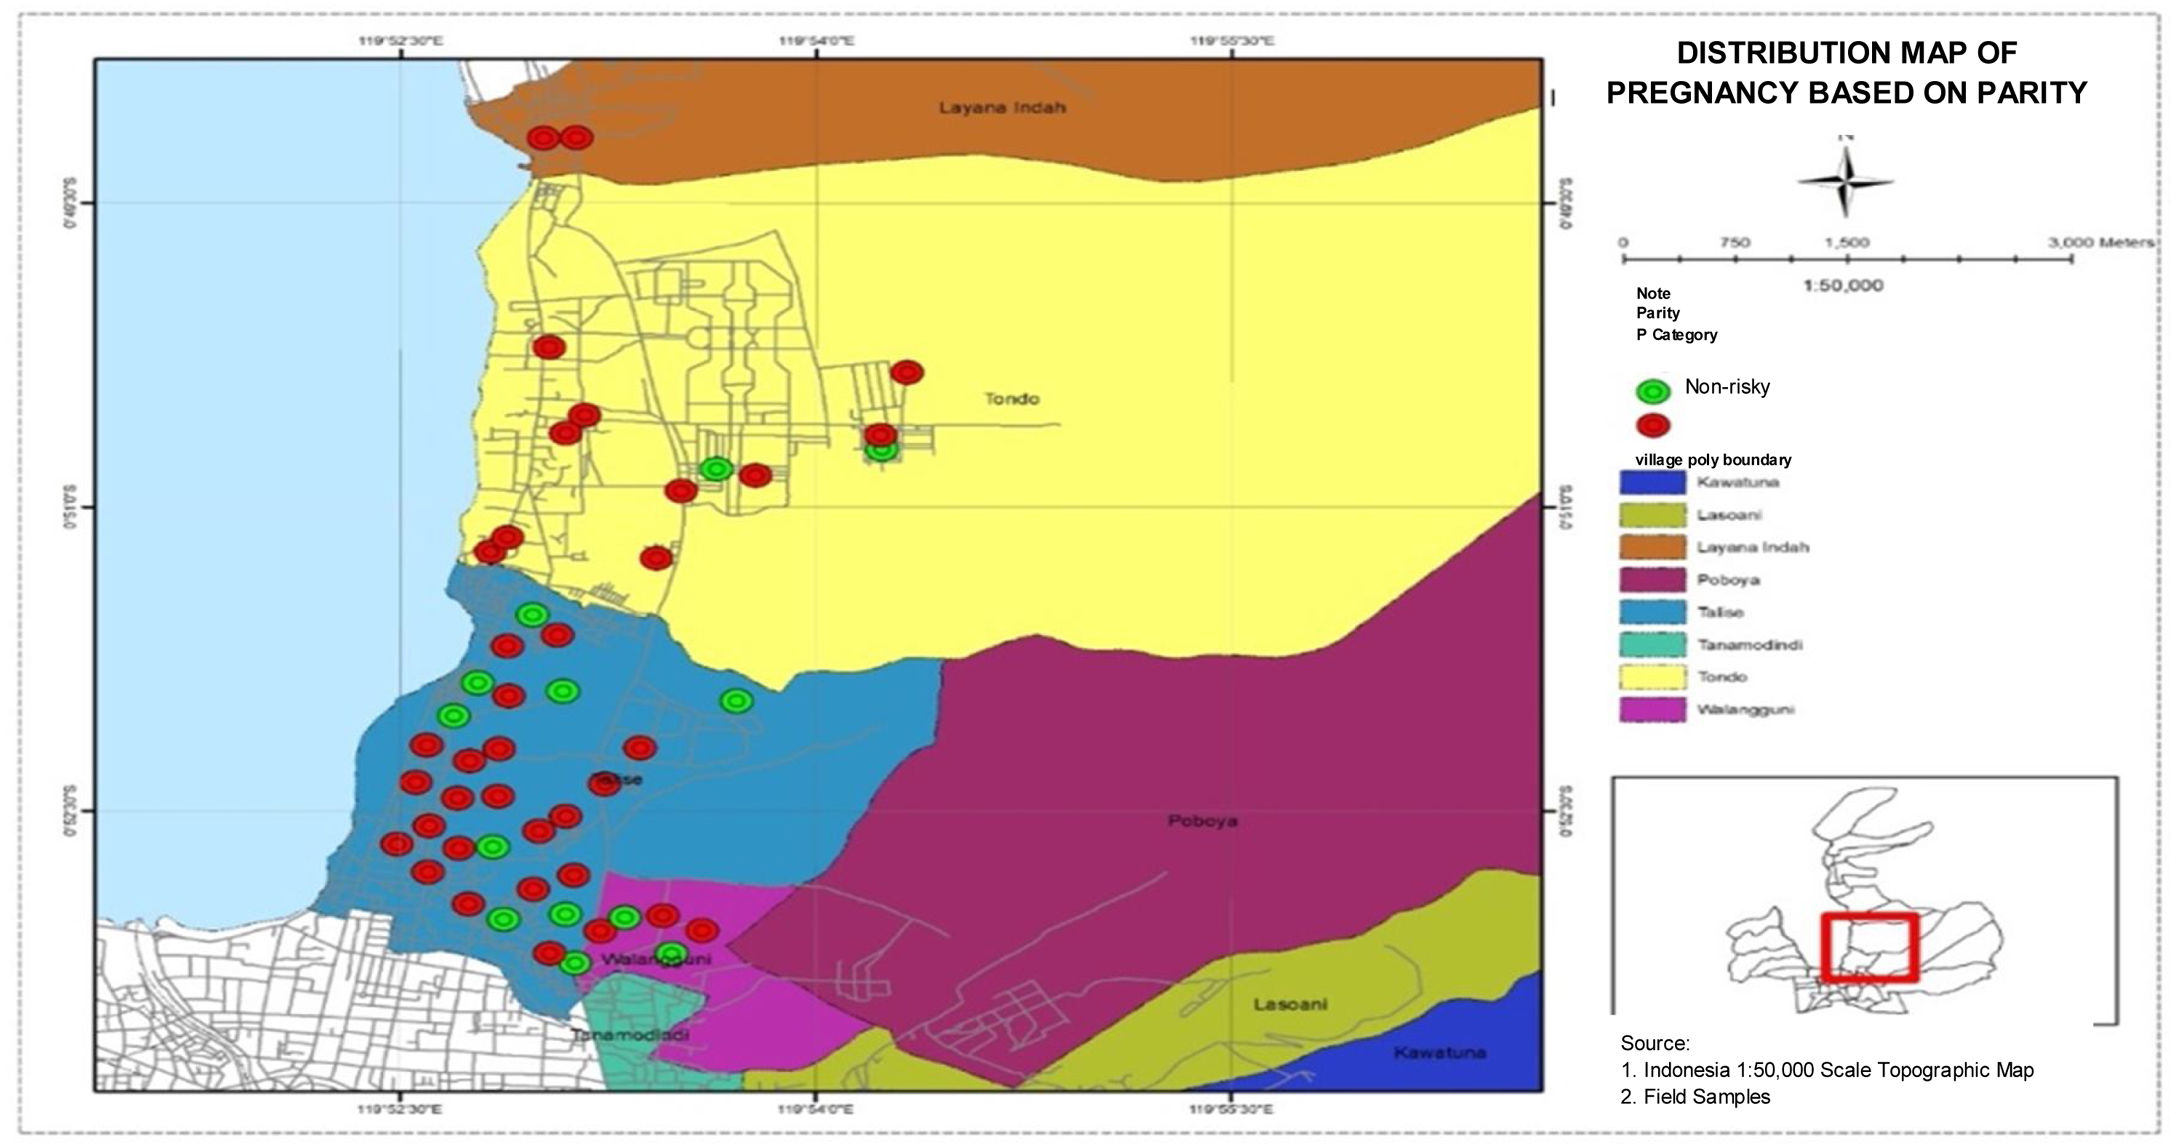
Distribution map of pregnant women based on parity
Distribution map of pregnant women based on parity in four villages in the work area of Talise Health Center, Palu shows that the highest number of high-risk pregnancies based on parity was found in Talise, and the lowest number of high-risk pregnancies based on parity were found in Lavana. The distribution data are presented in Fig. 4.
Distribution map of pregnant women based on pregnancy history
Distribution map of pregnant women based on pregnancy history in four villages in Talise Health Center, Palu City, shows that the highest number of high-risk pregnancies based on pregnancy history was found in Talise, and the lowest number of high-risk pregnancies based on pregnancy history were found in Ualangguni and Lavana. The distribution data are presented in Fig. 5.
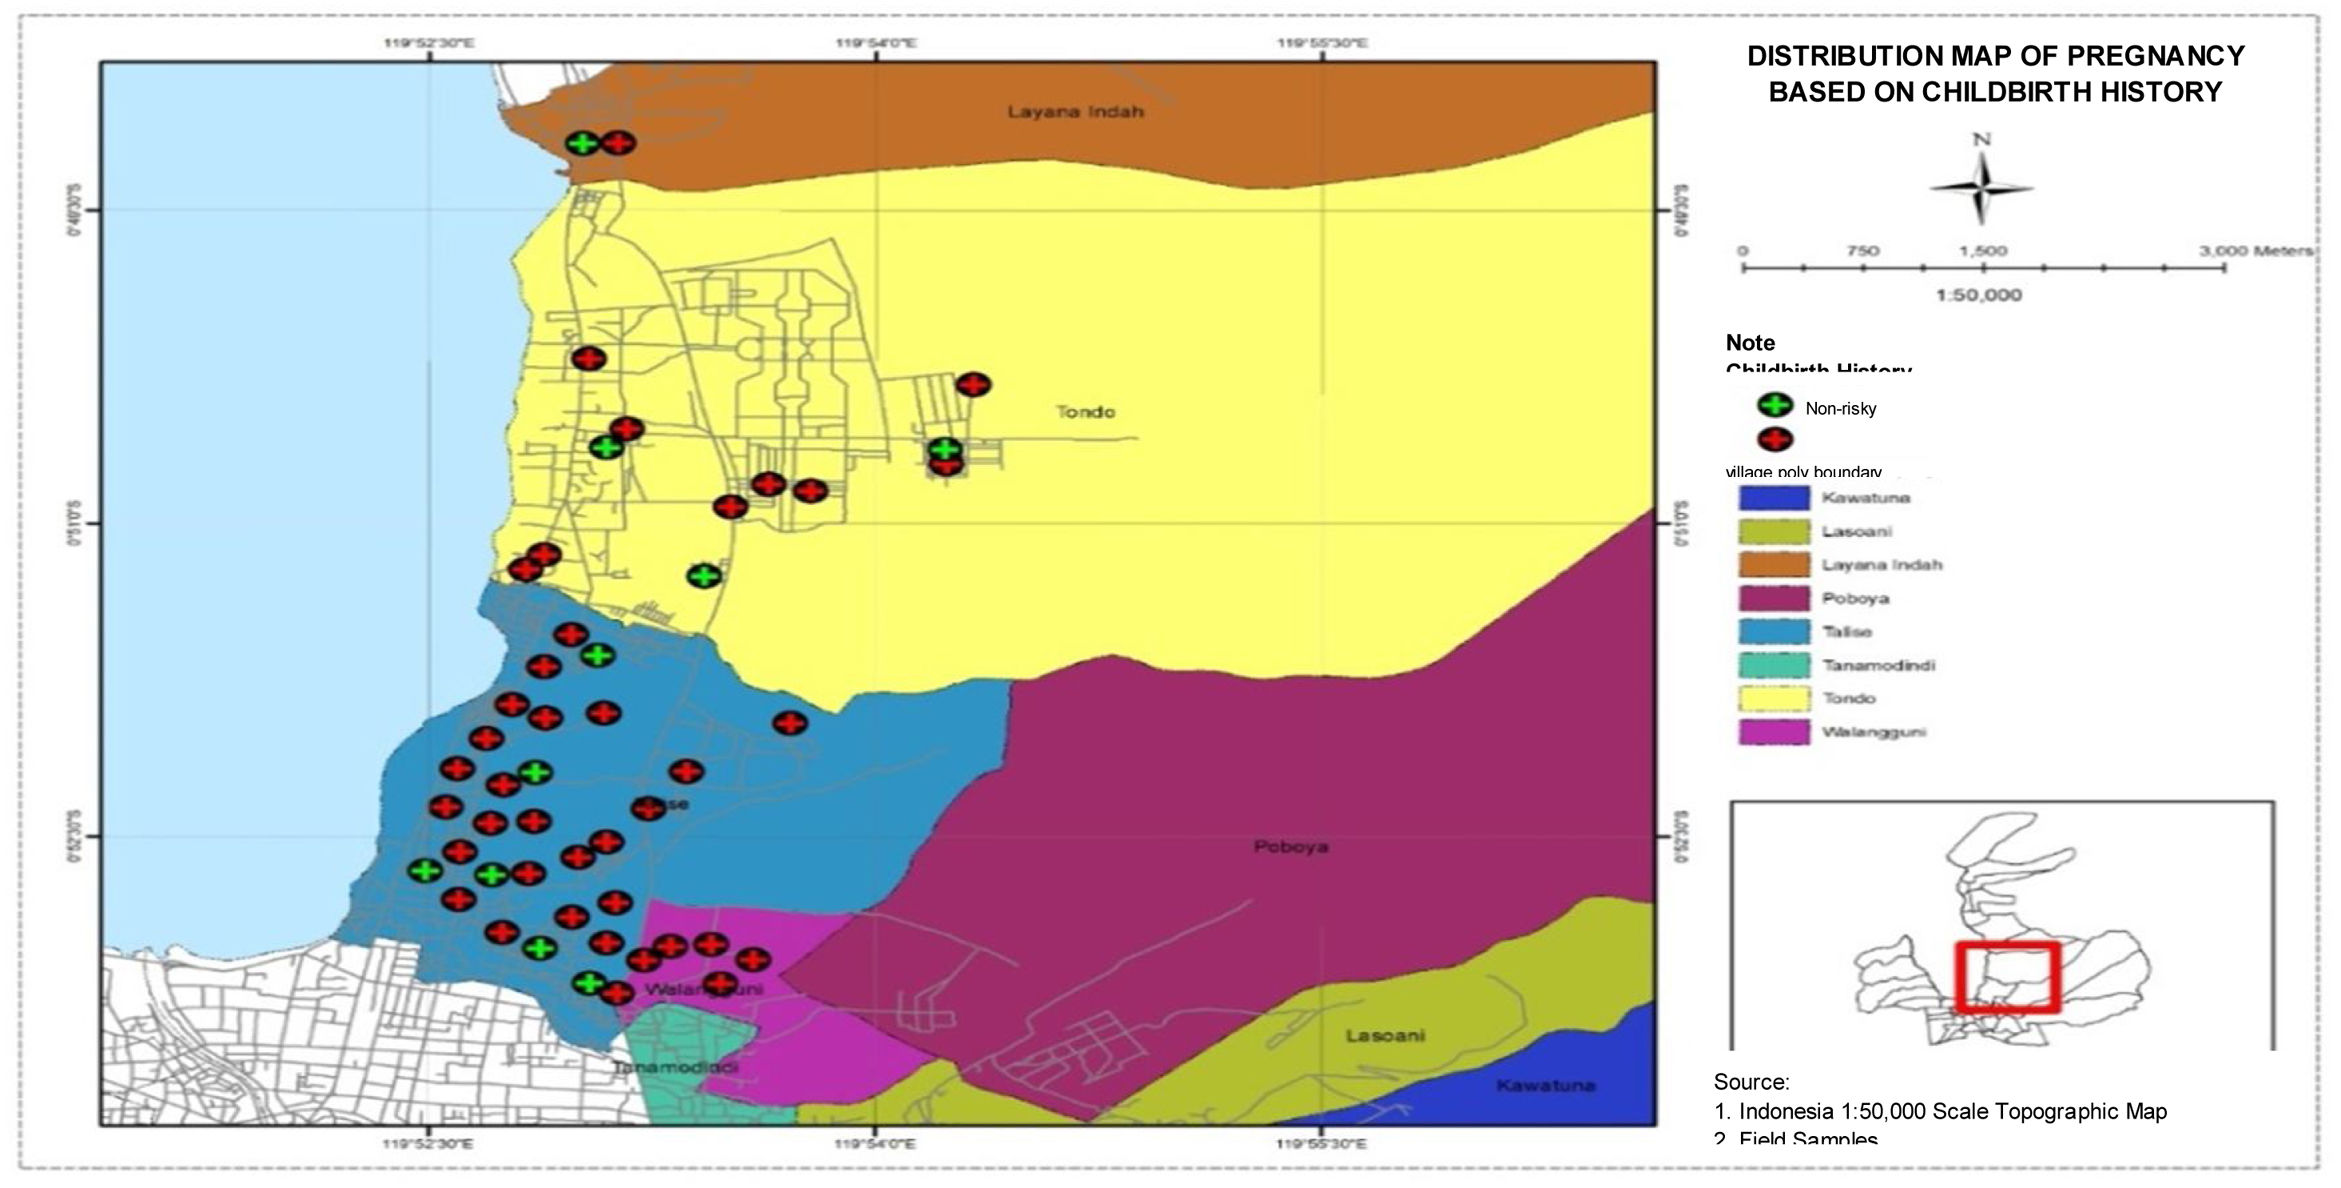
Distribution map of pregnant women based on childbirth history
Fig. 6 shows a map of the distribution of pregnant women based on childbirth history in four villages in Talise Health Center, Palu City. It can be seen that the highest number of high-risk pregnancies based on childbirth history were found in Talise, and the lowest number of high-risk pregnancies based on childbirth history were found in Lavana.
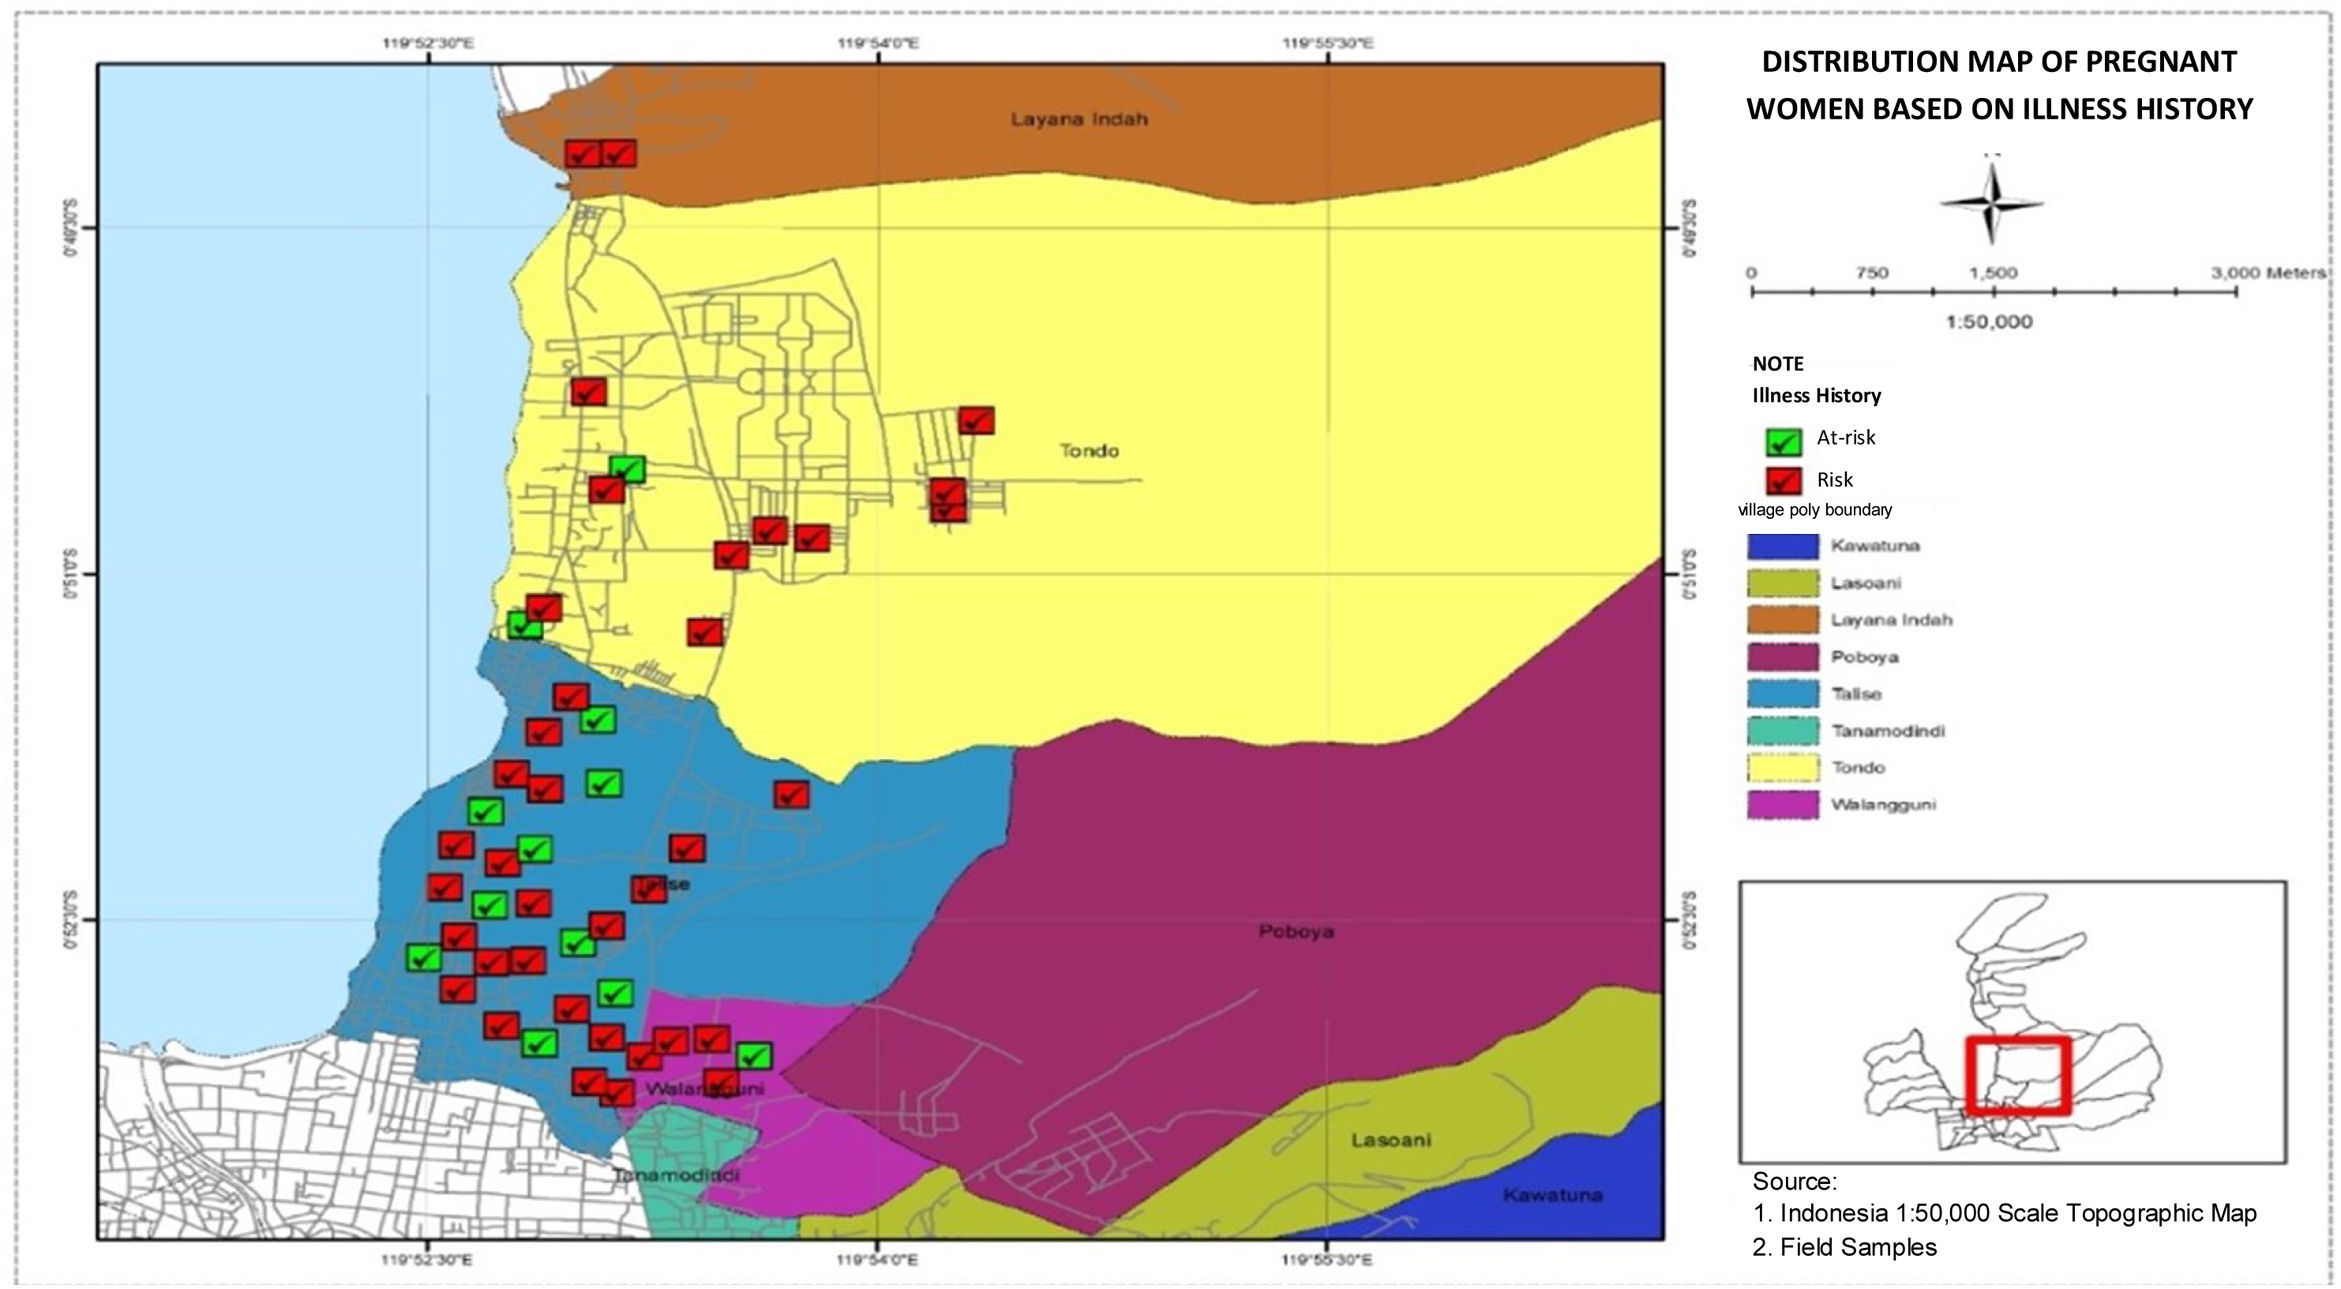
Distribution map of pregnant women based on illness history
Fig. 7, the distribution map of pregnant women based on illness history in the four villages in Talise Health Center, Palu City shows the highest number of high-risk pregnancies based on illness history were found in Talise, and the lowest number of high-risk pregnancies based on illness history were found in Lavana.
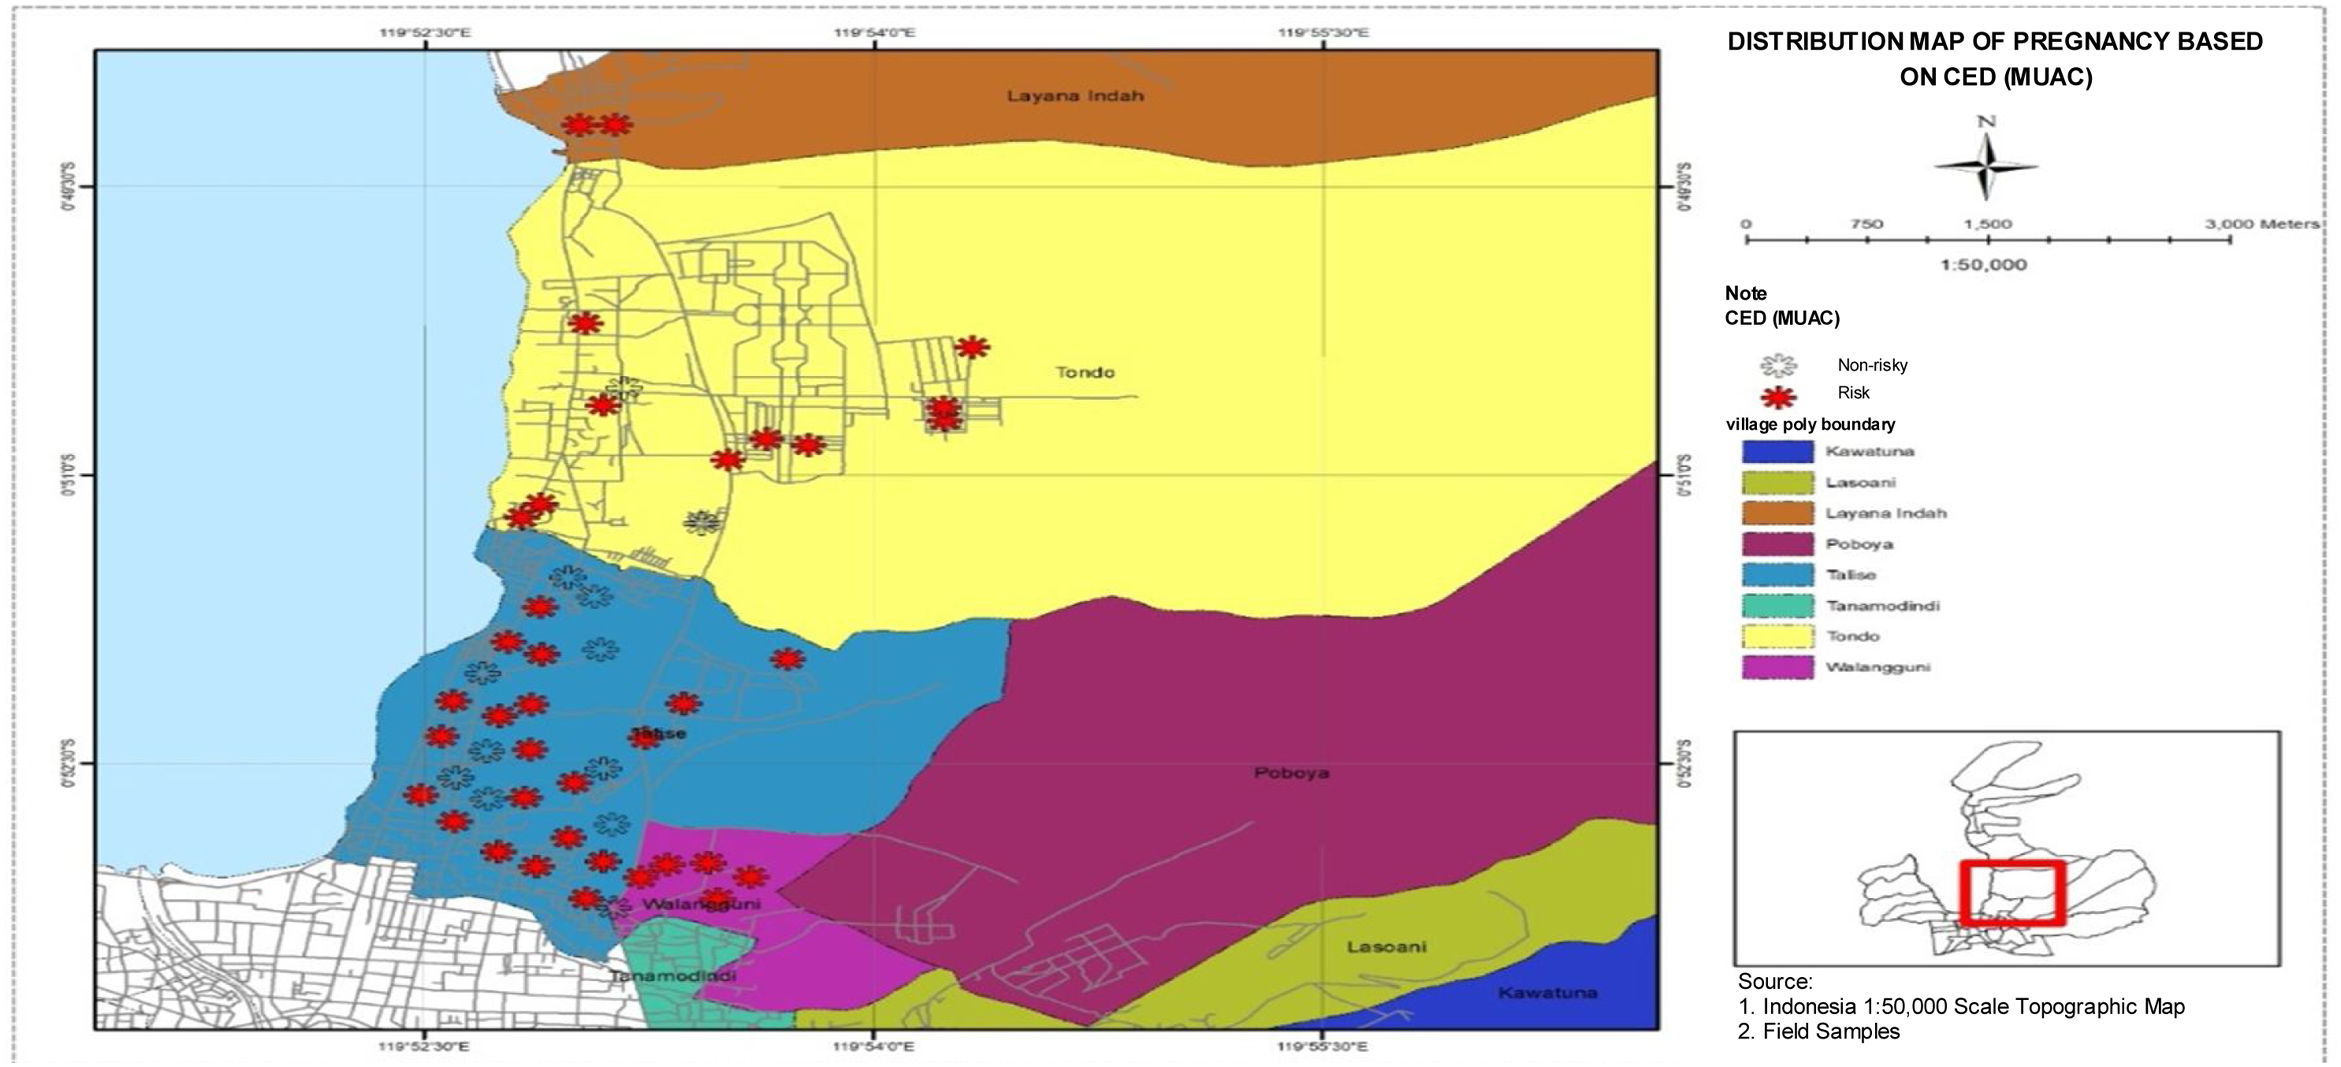
Distribution map of pregnant women based on CED status history
Fig. 8 presents a distribution map of pregnant women based on CED status history in four villages in Talise Health Center, Palu City. Based on the map, the highest number of high-risk pregnancies based on CED status history were found in Talise, and the lowest number of high-risk pregnancies based on CED status history were found in Lavana.
Relationship between age, parity, pregnancy history, childbirth history, illness history, and CED status with a high-risk pregnancy
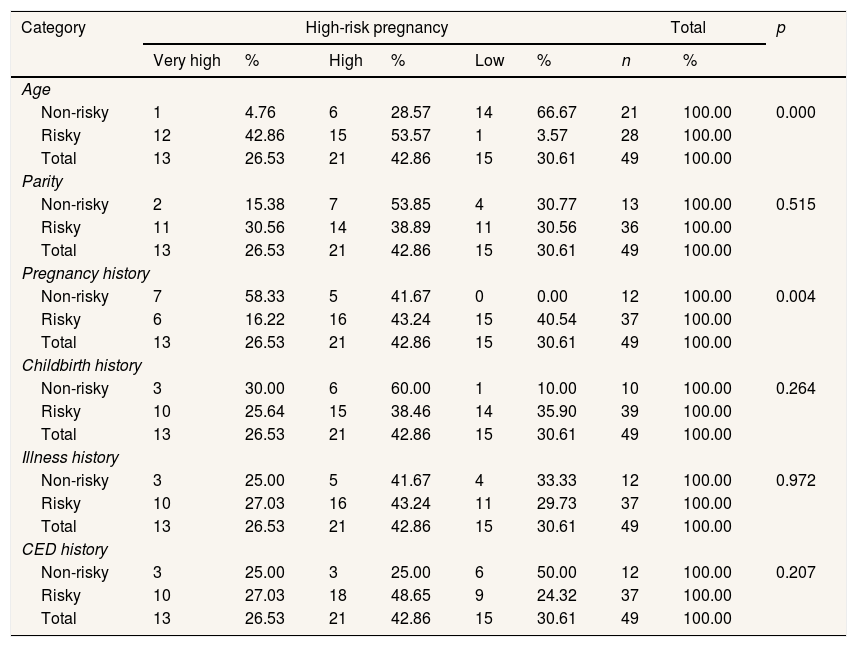
The relationship between age, parity, pregnancy history, childbirth history, illness history, and CED status with High-Risk Pregnancy was analyzed using cross-tabulation in the Chi-square test. The results can be seen in the following Table 2.
analyzed pregnancy using cross-tabulation in the Chi-square test.
| Category | High-risk pregnancy | Total | p | ||||||
|---|---|---|---|---|---|---|---|---|---|
| Very high | % | High | % | Low | % | n | % | ||
| Age | |||||||||
| Non-risky | 1 | 4.76 | 6 | 28.57 | 14 | 66.67 | 21 | 100.00 | 0.000 |
| Risky | 12 | 42.86 | 15 | 53.57 | 1 | 3.57 | 28 | 100.00 | |
| Total | 13 | 26.53 | 21 | 42.86 | 15 | 30.61 | 49 | 100.00 | |
| Parity | |||||||||
| Non-risky | 2 | 15.38 | 7 | 53.85 | 4 | 30.77 | 13 | 100.00 | 0.515 |
| Risky | 11 | 30.56 | 14 | 38.89 | 11 | 30.56 | 36 | 100.00 | |
| Total | 13 | 26.53 | 21 | 42.86 | 15 | 30.61 | 49 | 100.00 | |
| Pregnancy history | |||||||||
| Non-risky | 7 | 58.33 | 5 | 41.67 | 0 | 0.00 | 12 | 100.00 | 0.004 |
| Risky | 6 | 16.22 | 16 | 43.24 | 15 | 40.54 | 37 | 100.00 | |
| Total | 13 | 26.53 | 21 | 42.86 | 15 | 30.61 | 49 | 100.00 | |
| Childbirth history | |||||||||
| Non-risky | 3 | 30.00 | 6 | 60.00 | 1 | 10.00 | 10 | 100.00 | 0.264 |
| Risky | 10 | 25.64 | 15 | 38.46 | 14 | 35.90 | 39 | 100.00 | |
| Total | 13 | 26.53 | 21 | 42.86 | 15 | 30.61 | 49 | 100.00 | |
| Illness history | |||||||||
| Non-risky | 3 | 25.00 | 5 | 41.67 | 4 | 33.33 | 12 | 100.00 | 0.972 |
| Risky | 10 | 27.03 | 16 | 43.24 | 11 | 29.73 | 37 | 100.00 | |
| Total | 13 | 26.53 | 21 | 42.86 | 15 | 30.61 | 49 | 100.00 | |
| CED history | |||||||||
| Non-risky | 3 | 25.00 | 3 | 25.00 | 6 | 50.00 | 12 | 100.00 | 0.207 |
| Risky | 10 | 27.03 | 18 | 48.65 | 9 | 24.32 | 37 | 100.00 | |
| Total | 13 | 26.53 | 21 | 42.86 | 15 | 30.61 | 49 | 100.00 | |
The data in Table 2 shows that the Chi-Square test on the age factor yields a p-value of 0.000 or p<0.05. Therefore, Ho was rejected, which means that there was a relationship between age and high-risk pregnancy. Likewise, a pregnancy history obtains a p-value of 0.004 or below 0.05, which means that Ho was rejected. It shows that there was a relationship between previous pregnancy history and high-risk pregnancy. Meanwhile, the parity test obtained a p-value of 0.515, which was greater than 0.05. It shows that Ho was rejected, which means that there was no relationship between parity and high-risk pregnancy. Childbirth History and Illness History each obtained p values of 0.264 and p of 0.972, while CED Status History also obtained p-value>0.05. It means that there was no relationship between these three factors and high-risk pregnancy.
DiscussionMapping of pregnant women with high-risk pregnancy based on age, parity, pregnancy history, childbirth history, illness history, and CED status history
Fig. 3 shows that the highest number of women who had risks during pregnancy was found in Talise. Age is the period of time of an individual who is calculated from birth until entering his/her birthday in the current year. A person's age determines the level of maturity in thinking, acting, and in dealing with various possibilities of life, especially when a woman is pregnant. The higher a person's age, the higher the level of community trust. It is related to the dimension of maturity in building interactions.8 Moreover, there is a relationship between mature age and the maturity of one's soul as a result of the life experiences they have lived. Mature age, high trust and ways of thinking are very influential in building life and happiness.9
High-risk pregnancy, as presented in Fig. 1, showed that mothers with an age range of 31–40 years were categorized as high risk. Women over the age of 35 years have uterine organs undergoing an aging process, in which the function of systems and organs, including muscles, nerves, endocrine, and reproduction, has decreased.10 Changes in uterine tissue and birth canal have begun to stiff so that the degree of flexibility has decreased which risks the occurrence of shoulder dystocia (happens when one or both a baby's shoulders get stuck inside mother's pelvis during childbirth) and bleeding, which in fact can be fatal for pregnant women.11
Someone over the age of 35 years is more likely to develop various diseases, including pregnant women such as hypertension, diabetes mellitus, heart disease, and anemia.12 Thus, pregnancy over the age of 35 can increase the risk of pregnancy. Furthermore, the worst possibility, psychological burden experienced by pregnant women, will be higher, which has the potential to give a greater risk to both pregnant women and the fetus.
The highest number of high-risk pregnancies based on parity was found in Talise, as presented in Fig. 4, with the majority of pregnant women totaling 73.5%. The level of frequency of childbirth causes stretching of the uterus, which results in sagging of the uterine wall, including a decrease in its level of elasticity.13 The sagging of the uterine wall will cause abnormalities in pregnancy. Besides, the frequency of childbirth encourages degeneration and necrosis of the wound from implantation of the placenta in the endometrial wall, which causes deterioration and reduces endometrial vascularization of the uterine corpus. Degeneration is a condition that occurs both physically and chemically in cells, tissues, or organs so that the work efficiency of organs will decrease. In the condition of pregnancy, reduced vascularization in the area becomes infertile and not ready to accept the results of conception, nutrition, and oxygenation to the results of conception.14 Additionally; it also causes disruption of blood circulation to the fetus which results in a risk of pregnancy.
The highest number of high-risk pregnancies based on pregnancy history was found in Talise, as presented in Fig. 5. One of the examples of risky pregnancy history is recurrent miscarriage in which the fetus is released before being able to live outside the womb. The risk of miscarriage has a percentage of 15–40% of pregnant women and 60–70% occurs before three months of gestation.15 Pregnancy with placenta previa is also an example of risky previous pregnancy history for the next pregnancy. It is a complication of pregnancy because the placenta is located in the lower part covering partially or completely the cervix or opening of the birth canal. Understanding the history of previous risky pregnancies can be information in the handling of pregnant women in the context of medical action if something happens or is used in the process of anticipation or prevention of all risks that might occur.
The highest number of high-risk pregnancies based on childbirth history, as presented in Fig. 6, were found in Talise. There is a significant relationship between previous childbirth history, especially those experiencing Low Birth Weight with a high-risk pregnancy. Two examples of risky childbirth history include premature birth when pregnancy enters the 37th week of pregnancy and stillbirth as birth without any signs of life in pregnancy for more than 24 weeks.16 Malnutrition during pregnancy can affect the growth process of the fetus and can cause miscarriage, stillbirth, neonatal death, and asphyxia. Prevention of malnutrition and nutritional determination can be done by measuring maternal weight before pregnancy and weight gain during pregnancy.
The highest number of high-risk pregnancies based on illness history were found in Talise, as presented in Fig. 7. Preeclampsia in chronic hypertension that occurs in pregnant women who suffer from hypertension before pregnancy has a high risk.17 In addition, diabetes, kidney disease, and obesity can also cause preeclampsia. A history of severe illness is very dangerous to the condition of pregnant women, so those who have illness history have a greater risk of experiencing preeclampsia during pregnancy than mothers who have no illness history.
The highest number of high-risk pregnancies based on CED status history were found in Talise. Stunting is one of the nutritional problems experienced by toddlers in the world recently. Stunting is when a toddler has a low height for their age. Stunted toddlers include chronic nutritional problems caused by many factors such as socio-economic conditions, maternal nutrition during pregnancy, morbidity in infants, and lack of intake in infants. Stunted toddlers in the future will experience difficulties in achieving optimal physical and cognitive development as toddlers of their age who are not malnourished.
Relationship between age, parity, pregnancy history, childbirth history, illness history, and CED status history with a high-risk pregnancyThe results of statistical analysis showed that there was a relationship between the ages of pregnant women. Based on the analysis results as presented in Table 2, more than half of the respondents are at high-risk and very high-risk pregnancies, which are 53.57% and 42.86%, respectively. The results of this study are similar to a study conducted by Novo et al. at Nanggalo Health Center, which finds a high-risk pregnancy prevalence of 44.8%.18 The high risk of pregnancy at Lubuk Gadang Health Center is due to the high frequency of risk factors in pregnant women, where less than half of the respondents (46.9%) are at high-risk gestational age. This study is in line with a study conducted by Steeg et al., where 45% of respondents have a high risk at the age of more than 35 years. The age of pregnant women over 35 years is an age that has a high risk both during pregnancy and childbirth.19
Data from research after statistical analysis revealed that there was no relationship between parity and the incidence of high-risk pregnancies. This is in line with previous research, which confirms that statistically, parity is not associated with the incidence of asphyxia with a p-value of 0.142>0.05. This is caused by the occurrence of asphyxia, which can occur by various factors from the mother, fetus, or placenta.
There was a relationship between previous pregnancy history with the incidence of high-risk pregnancy, as has been revealed by previous studies. Previous pregnancy history experienced placenta previa with a high-risk pregnancy with a p-value of 0.011. The previous pregnancy history that is at risk includes recurrent miscarriages where the fetus is released before being able to live outside the womb, and the risk of miscarriage has a percentage of 15–40% of pregnant women and 60–70% occurs before three months of gestation. Pregnancy with placenta previa is also an example of risky previous pregnancy history for the next pregnancy. It is a complication of pregnancy because the placenta is located in the lower part covering partially or completely the cervix or opening of the birth canal.
There was no relationship between childbirth history and the incidence of a high-risk pregnancy. Pregnancy risk is a condition that has a disruption in pregnancy that can have an impact on both the mother and fetus during pregnancy and childbirth. There are many cases of high-risk pregnant women. This study is not in line with some previous studies which mentioned that mothers who experience complications in pregnancy have a significant relationship with the incidence of childbirth complications; in which mothers who experience complications during pregnancy are 2.72 times more likely to experience complications in childbirth than mothers who do not experience complications in pregnancy.20
The study also found that there was no significant relationship between illness history and the incidence of a high-risk pregnancy. Illness experienced before and during pregnancy can also increase the risk of maternal death during pregnancy. Moreover, the condition of pregnancy illness history that is not getting good treatments increases the risk of preeclampsia. For pregnant women, especially those who have hereditary factors for preeclampsia and previous illness histories such as chronic hypertension, diabetes, kidney disease, and obesity are expected to be able to limit the number of children desired and carry out pregnancy checks as often as possible during pregnancy and maintain a balanced diet with nutrition to overcome the occurrence of preeclampsia during childbirth.
It was also found that there was no significant relationship between CED status history and the incidence of a high-risk pregnancy. The results of this study are not in line with the results of a study conducted by Krupp et al., which find that the birth weight of a baby is also influenced by several factors, namely Chronic Energy Deficiency (CED) status and anemia in pregnant women.21 Chronic Energy Deficiency status can occur in women of childbearing age and in pregnant women. It illustrates the condition of the mother who suffers from food shortages that last for years.22 One of the ways to find out the nutritional status of pregnant women at risk for CED is the measurement of MUAC, that MUAC <23.5cm has a risk of giving birth to LBW.23 Based on the results of a study conducted by Amri et al. pregnant women who are exposed to CED have a higher probability of giving birth to LBW than those who are not exposed to CED; poor nutritional status before or during pregnancy tends to cause mothers to give birth to LBW.24 It is also in line with a study by Ro et al. at Hospital which points out that the better MUAC, the better the baby's birth weight and vice versa.25
ConclusionTo sum up, all women with very high-risk and high-risk pregnancy are found in Talise, with the lowest number of cases found in Layana Village. Based on age, the highest number is also found in Talise, while based on parity, many cases are found in Talise. Moreover, based on pregnancy history, childbirth history, illness history, and CED status history are all found in Talise. Age and childbirth history have a relationship with a high-risk pregnancy. Therefore, it can be concluded that age and pregnancy history have a significant influence. The use of GIS Maps makes it easier to find locations of high-risk and non-risk pregnant women.
Conflict of interestThe authors declare no conflict of interest.
Peer-review under responsibility of the scientific committee of the 3rd International Nursing, Health Science Students & Health Care Professionals Conference. Full-text and the content of it is under responsibility of authors of the article.


