



Health reforms in Latin America and the Caribbean
More infoMexican health system is organized around social security (SS) entitlement, dividing the population into insured and uninsured groups, which represents a potential source of health inequity. The objective is to analyze life expectancy (LE) and healthy-adjusted life expectancy (HALE) between both populations.
MethodEcological study was conducted at national and state levels for 2020, disaggregated by sex. LE and HALE for both populations were estimated. Statistical differences between them were assessed using Student's t-test or Wilcoxon rank-sum test, depending on the normality of the distributions.
ResultsLE was higher in younger groups for population with SS when men and women were analyzed together, as well as for men independently. This pattern reversed at ages 30-34, after which the group without SS exhibited higher LE. However, these differences were not statistically significant. For HALE, the group without SS showed lower values across all age groups. These differences were statistically significant. Findings at state level were consistent with those observed at national level.
ConclusionsLE didn’t differ significantly between both populations. Nevertheless, the population with SS exhibited higher HALE, suggesting closer contact with health services. Therefore, the organization of the Mexican health system around SS may be a determinant in the generation of health inequities by segregating the Mexican population.
El sistema de salud mexicano está organizado alrededor de la afiliación a la seguridad social (SS), lo que divide a la población en asegurada y no asegurada, y representa una posible fuente de inequidad en salud. El objetivo es analizar la esperanza de vida (EV) y la esperanza de vida libre de discapacidad (EVLD) entre ambas poblaciones.
MétodoSe realizó un estudio ecológico de ámbito nacional y estatal para 2020, desagregado por sexo. Se estimaron la EV y la EVLD para ambas poblaciones. Las diferencias entre grupos se evaluaron mediante la prueba t de Student o de rangos de Wilcoxon, según la distribución de la normalidad.
ResultadosLa EV fue mayor en los grupos más jóvenes de la población con SS cuando se analizaron hombres y mujeres conjuntamente, así como en los hombres por separado. Este patrón se invirtió a partir del grupo de 30-34 años, en el que las personas sin SS presentaron mayor EV. No obstante, estas diferencias no fueron estadísticamente significativas. Para la EVLD, el grupo sin SS mostró valores menores en todos los grupos de edad, con diferencias estadísticamente significativas. Los hallazgos estatales fueron concordantes con los nacionales.
ConclusionesLa EV no difirió significativamente entre ambas poblaciones. Sin embargo, la población con SS presentó una EVLD mayor, lo que sugiere un contacto más estrecho con los servicios de salud. Por lo tanto, la organización del sistema de salud mexicano en torno a la SS podría ser un determinante en la generación de inequidades en salud al segregar a la población mexicana.
One of the main functions of health systems is to provide services that prevent disease, deliver timely care, and restore health.1 Limited access to healthcare leads to delays in diagnosis and treatment, which increases the risk of disability and death. Therefore, health systems are considered an intermediate social determinant of health (SDH) and a key element through which equity can be achieved.2
Mexico has a segmented health system in which access to healthcare is structured around social security (SS) entitlement, dividing the population into insured and uninsured groups. SS encompasses social protection mechanisms against life risks, including insurance for occupational hazards and disability, retirement pensions, childcare services, and access to healthcare. By law, individuals receive preventive services for chronic diseases, mental health, oral health, and maternal and child health, as well as programs promoting healthy aging and specialized medical services.3,4 Therefore, it's internationally recognized as a human right that contributes to individual and collective well-being, as established in instruments such as the Universal Declaration of Human Rights, the International Covenant on Economic, Social and Cultural Rights, and the Sustainable Development Goals.5,6 Despite this recognition, Article 123 of the Mexican Constitution restricts SS coverage to formal workers and their families. As a result, nearly half of the Mexican population has historically been excluded from SS benefits.7
The uninsured population relies on public health services outside SS system. Although private healthcare is also an alternative, it's accessed mainly through out-of-pocket payments or private insurance and remains costly, resulting in its use by only a very small share of the population.7 Consequently, access to healthcare in Mexico has historically depended on SS affiliation.
In addition, total health expenditure, per-capita health expenditure,8 and the availability of physicians, nurses, and hospital beds have been consistently higher in SS institutions.9 Evidence has shown that greater availability of health resources, as well as increased opportunities for contact with health services among insured populations, can enhance population health outcomes by enabling timely disease detection, follow-up of health conditions, and appropriate treatment, thereby preventing complications and mortality.10,11 In Mexico, SS-affiliated populations have been reported to use health services more frequently,12 for example breast cancer screening.13 Consequently, these distinctions could be associated with measurable differences in lower mortality from maternal causes,14 chronic kidney disease,15 and ischemic heart disease16 among people with SS coverage. Nevertheless, contradictory evidence has been documented, reporting better outcomes among non-SS populations regarding amenable mortality,17 and a higher mortality risk in older adults with SS affiliation.18
This mixed evidence raises an unresolved question, if this division among SS and non-SS populations translate into differences in health. To clarify this, it's important to conduct an in-depth analysis using impact indicators capable of reflecting the cumulative effect of health determinants over time, such as life expectancy (LE) and health-adjusted life expectancy (HALE). These indicators summarize the population's health status by reflecting the magnitude and quality of the remaining years of life and, indirectly, represent broader structural conditions, including economic, educational, and nutritional factors, as well as the availability and performance of healthcare and public health services.19 Therefore, the objective of this research is to analyze life expectancy and healthy-adjusted life expectancy between SS and non-SS populations in Mexico.
MethodStudy populationWe conducted an ecological study at national and state levels in Mexico using mortality data from the National Institute of Statistics and Geography (Instituto Nacional de Estadística y Geografía) and disability data from the National Population and Housing Census (Censo Nacional de Población y Vivienda). The year 2020 was chosen because the national census is conducted every ten years and provides the most recent and accurate population data across geographic scales. Additionally, it uses the Washington Group approach to measure disability, which allows for international comparability.
VariablesSS status in mortality and disability data was defined based on personal affiliation with any of the SS institutions: the Mexican Social Security Institute (IMSS, Instituto Mexicano del Seguro Social), the Institute of Security and Social Services for State Workers (ISSSTE, Instituto de Seguridad y Servicios Sociales de los Trabajadores del Estado), the Secretariat of National Defense (SEDENA, Secretaría de la Defensa Nacional), the Secretariat of the Navy (SEMAR, Secretaría de Marina), and the national oil company (Pemex, Petróleos Mexicanos). Data out of these institutions were classified as non-SS.
Disability was defined using the Washington Group approach, which evaluates six functional domains related to basic activities of daily living: seeing, hearing, mobility, self-care, cognition, and communication. Each domain includes response categories that reflect the degree of difficulty in performing the activity. Persons reporting “a lot of difficulty” or “cannot do the activity” in at least one domain were classified as having disability.20
Sociodemographic variables were included to characterize the population with and without SS. We considered sex, marital status (categorized as married or in union, and single [including divorced, separated, and widowed groups]), literacy (defined as the ability to read and write), education (categorized as higher than basic education, referring to those who completed primary and secondary school), indigenous language speaker, employment status (defined as having had a job in the previous week), type of residence (urban [≥2500 inhabitants] or rural [≤2500 inhabitants]), and the proportion of the population with access to sewerage services, electricity, and piped water. By characterizing both populations, we aim to provide context for the main outcomes. All variables were obtained from the National Population and Housing Census 2020.
AnalysisThe COVID-19 pandemic generated excess mortality in 2020,21 which could bias LE and HALE estimates and prevent a proper assessment of disparities between both populations. To avoid this distortion, 2020 mortality was projected using death records from 1998 to 2019 through the double exponential smoothing method (Holt method),22 which is indicated for mortality forecasting given the absence of seasonality in mortality trends.
The accuracy of the projection was evaluated using backtesting, which assesses how well a model can reproduce future observations based on past information. For this purpose, we generated an additional projection for 2019 and compared real versus projected values using the mean absolute percentage error (MAPE). MAPE is a widely used metric because it expresses errors in relative terms, is easy to interpret (projection precision ≤10% indicates high accuracy, 11–20% good accuracy, 21–50% reasonable accuracy, and>50% poor accuracy23), and allows comparisons across multiple time series with different scales.22 This procedure ensures that LE and HALE reflect expected mortality patterns in the absence of the pandemic, isolating the analysis from COVID-19-related excess mortality, while using the 2020 census.
Life expectancy and health-adjusted life expectancyLE was estimated using five-year abridged life tables, its methodology can be found elsewhere.24 In brief, life tables follow a hypothetical cohort whose members experience the age-specific mortality probabilities observed in the population until all persons have died. HALE was calculated using the Sullivan method, which incorporates disability prevalence to estimate the number of years lived free of disability.25 Based on these estimates, we also calculated the percentage of years lived with disability using the formula:

Indicators were estimated for the total population and populations with and without SS, at the national and state levels, disaggregated by sex. At national level, we conducted either a Student's t-test or a Wilcoxon rank-sum test, depending on the distribution's normality, to assess whether the differences between the two populations were statistically significant. While at state level, the same tests were applied to the sociodemographic variables, according to the distribution of the data, to evaluate whether these variables differed significantly between populations with and without SS.
All analyses were performed using Stata v.17.
Ethical approvalThis research was approved by the Research, Ethics, and Biosafety Committees of the National Institute of Geriatrics (DI-PI-012/2025).
ResultsAll national-level mortality projections showed high accuracy, and none of the state-level projections showed poor accuracy. The MAPE for the 2019 mortality projection is presented in Supplementary Table 1.
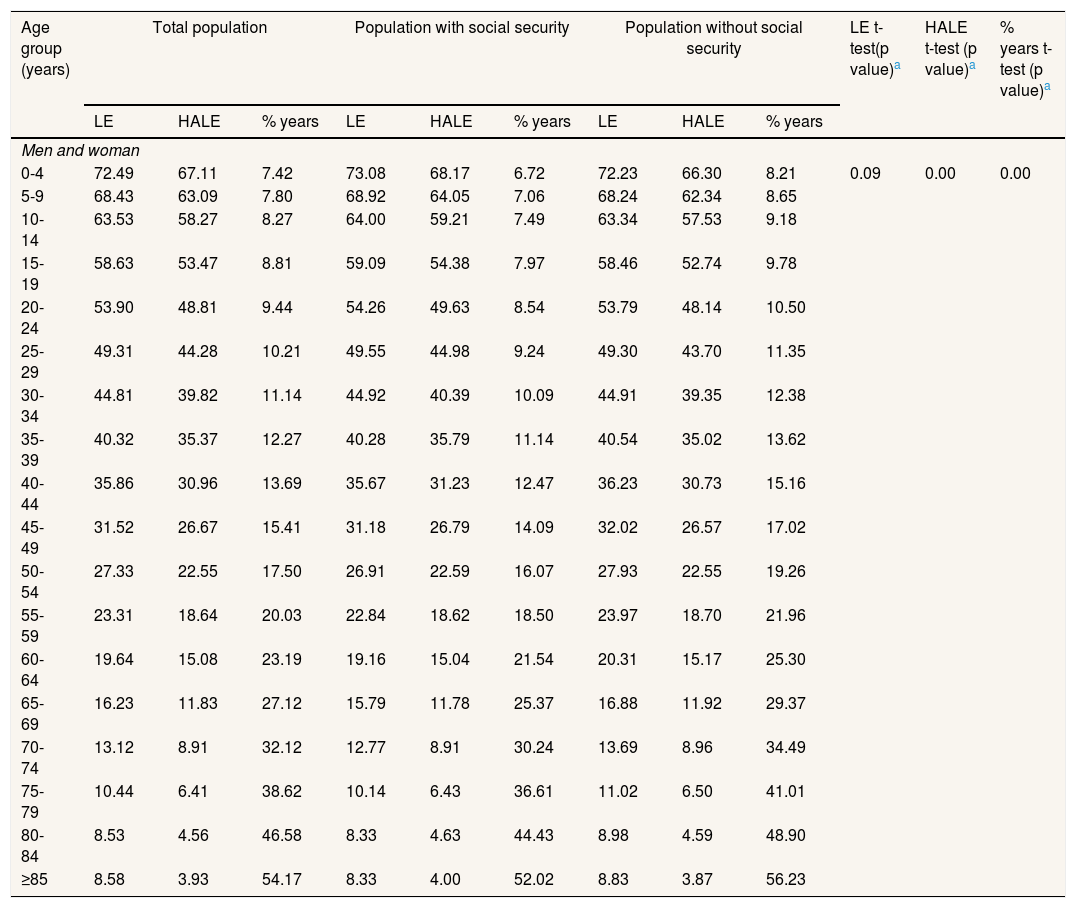
Table 1 reports LE and HALE for each five-year age group up to 85 years and older for total population and populations with and without SS. Data disaggregated by sex is found on Supplementary Table 2 When considering men and women together, as well as men separately, persons with SS have higher LE in the younger age groups. However, this pattern reverses at ages 30-34, after which persons without SS have higher LE in subsequent age groups. Among women, the non-SS group has higher LE in all age groups, although the differences are slight. Whereas, across all age groups and for both sexes, persons without SS have lower HALE. This is also reflected in the percentage of years lived with disability at each age, where the non-SS population consistently shows higher values for the total population, men, and women.
Life expectancy and health-adjusted life expectancy for total population, and populations with and without social security at national level.
| Age group (years) | Total population | Population with social security | Population without social security | LE t-test(p value)a | HALE t-test (p value)a | % years t-test (p value)a | ||||||
|---|---|---|---|---|---|---|---|---|---|---|---|---|
| LE | HALE | % years | LE | HALE | % years | LE | HALE | % years | ||||
| Men and woman | ||||||||||||
| 0-4 | 72.49 | 67.11 | 7.42 | 73.08 | 68.17 | 6.72 | 72.23 | 66.30 | 8.21 | 0.09 | 0.00 | 0.00 |
| 5-9 | 68.43 | 63.09 | 7.80 | 68.92 | 64.05 | 7.06 | 68.24 | 62.34 | 8.65 | |||
| 10-14 | 63.53 | 58.27 | 8.27 | 64.00 | 59.21 | 7.49 | 63.34 | 57.53 | 9.18 | |||
| 15-19 | 58.63 | 53.47 | 8.81 | 59.09 | 54.38 | 7.97 | 58.46 | 52.74 | 9.78 | |||
| 20-24 | 53.90 | 48.81 | 9.44 | 54.26 | 49.63 | 8.54 | 53.79 | 48.14 | 10.50 | |||
| 25-29 | 49.31 | 44.28 | 10.21 | 49.55 | 44.98 | 9.24 | 49.30 | 43.70 | 11.35 | |||
| 30-34 | 44.81 | 39.82 | 11.14 | 44.92 | 40.39 | 10.09 | 44.91 | 39.35 | 12.38 | |||
| 35-39 | 40.32 | 35.37 | 12.27 | 40.28 | 35.79 | 11.14 | 40.54 | 35.02 | 13.62 | |||
| 40-44 | 35.86 | 30.96 | 13.69 | 35.67 | 31.23 | 12.47 | 36.23 | 30.73 | 15.16 | |||
| 45-49 | 31.52 | 26.67 | 15.41 | 31.18 | 26.79 | 14.09 | 32.02 | 26.57 | 17.02 | |||
| 50-54 | 27.33 | 22.55 | 17.50 | 26.91 | 22.59 | 16.07 | 27.93 | 22.55 | 19.26 | |||
| 55-59 | 23.31 | 18.64 | 20.03 | 22.84 | 18.62 | 18.50 | 23.97 | 18.70 | 21.96 | |||
| 60-64 | 19.64 | 15.08 | 23.19 | 19.16 | 15.04 | 21.54 | 20.31 | 15.17 | 25.30 | |||
| 65-69 | 16.23 | 11.83 | 27.12 | 15.79 | 11.78 | 25.37 | 16.88 | 11.92 | 29.37 | |||
| 70-74 | 13.12 | 8.91 | 32.12 | 12.77 | 8.91 | 30.24 | 13.69 | 8.96 | 34.49 | |||
| 75-79 | 10.44 | 6.41 | 38.62 | 10.14 | 6.43 | 36.61 | 11.02 | 6.50 | 41.01 | |||
| 80-84 | 8.53 | 4.56 | 46.58 | 8.33 | 4.63 | 44.43 | 8.98 | 4.59 | 48.90 | |||
| ≥85 | 8.58 | 3.93 | 54.17 | 8.33 | 4.00 | 52.02 | 8.83 | 3.87 | 56.23 | |||
HALE: health-adjusted life expectancy; LE: life expectancy.
Regarding comparisons between both populations, the t-test showed that mean differences in LE between SS and non-SS groups were not statistically significant for the total population and for men. In contrast, LE differences among women and all HALE and the percentage of years lived with disability (for the total population, men, and women) were statistically significant. These findings indicate that although LE doesn’t differ significantly between SS and non-SS groups for the total population and for men, HALE differences do. Specifically, persons without SS live a greater number of years with disability than their counterparts, even when LE is similar.
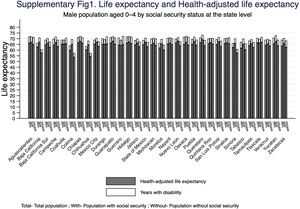
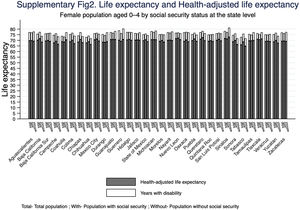
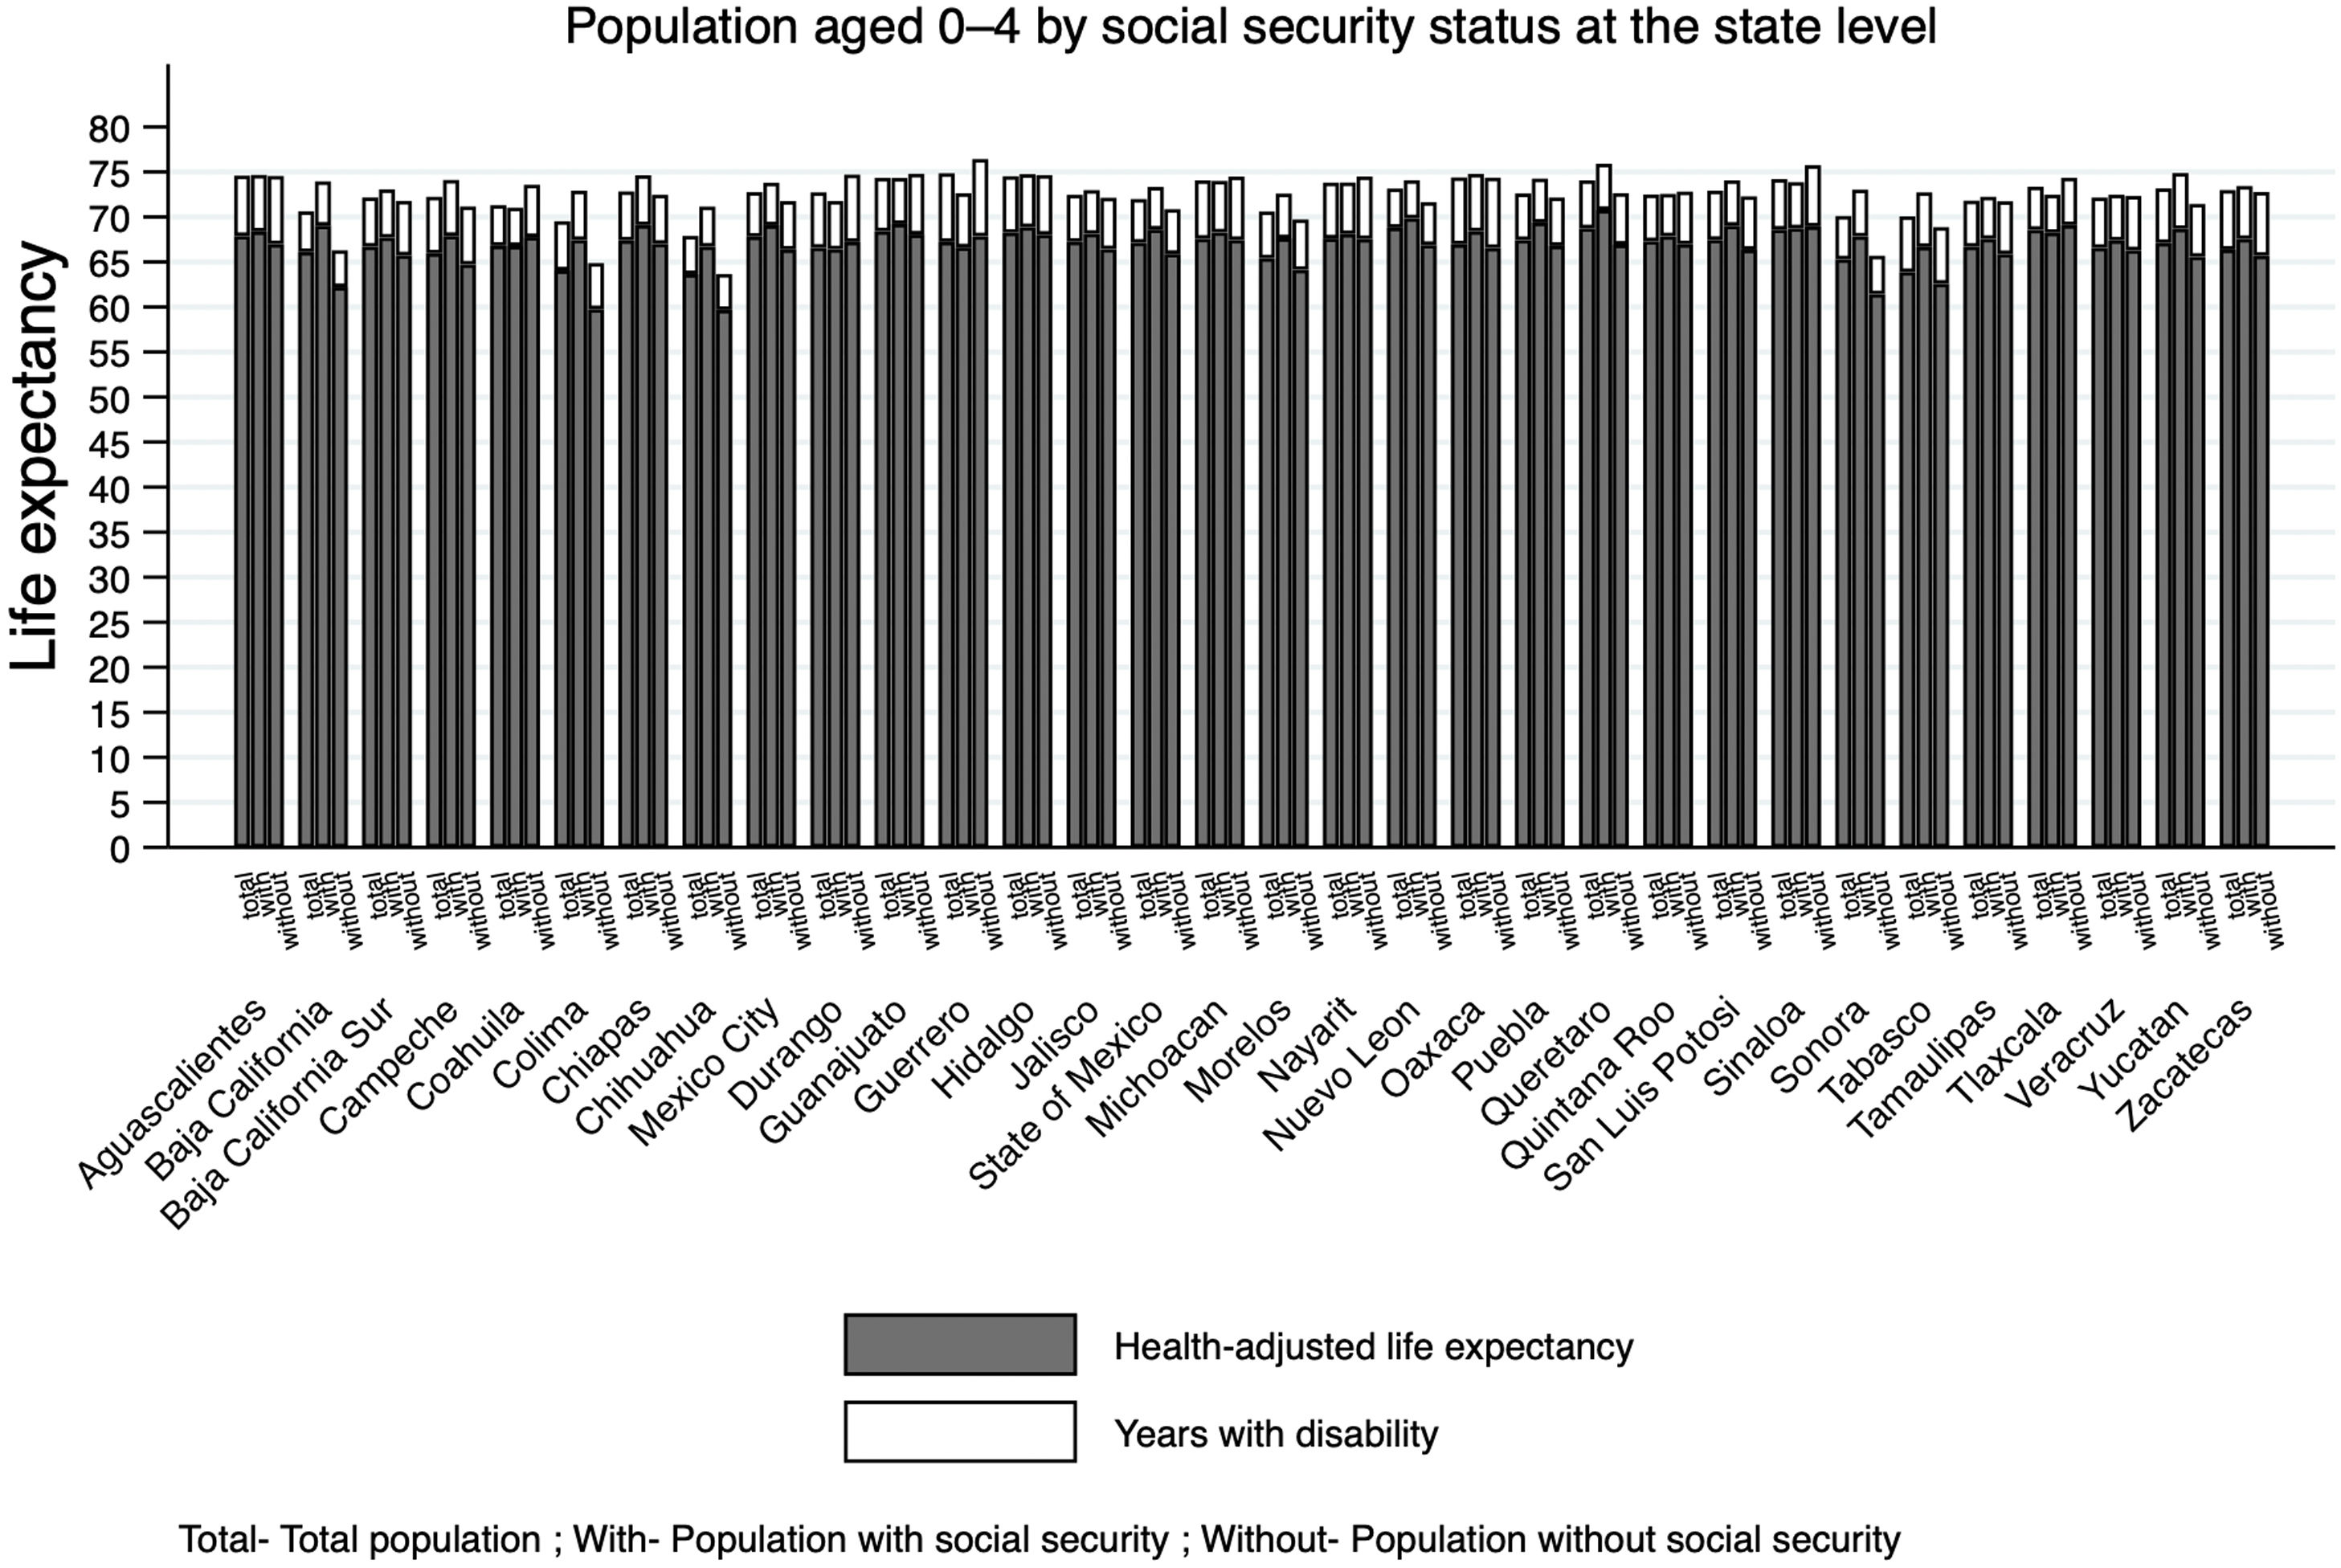
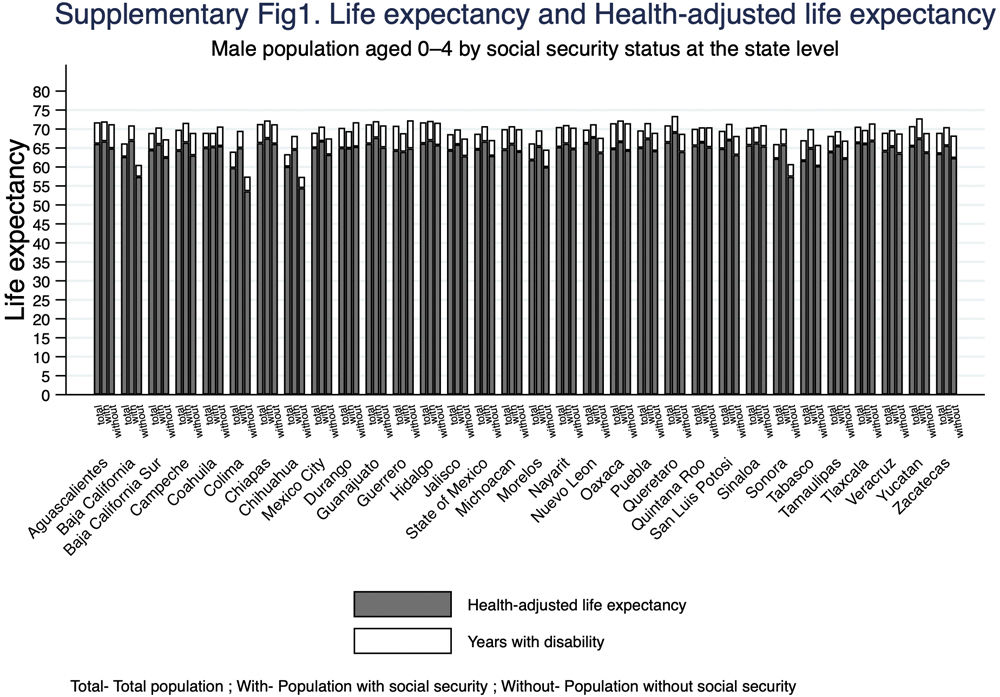
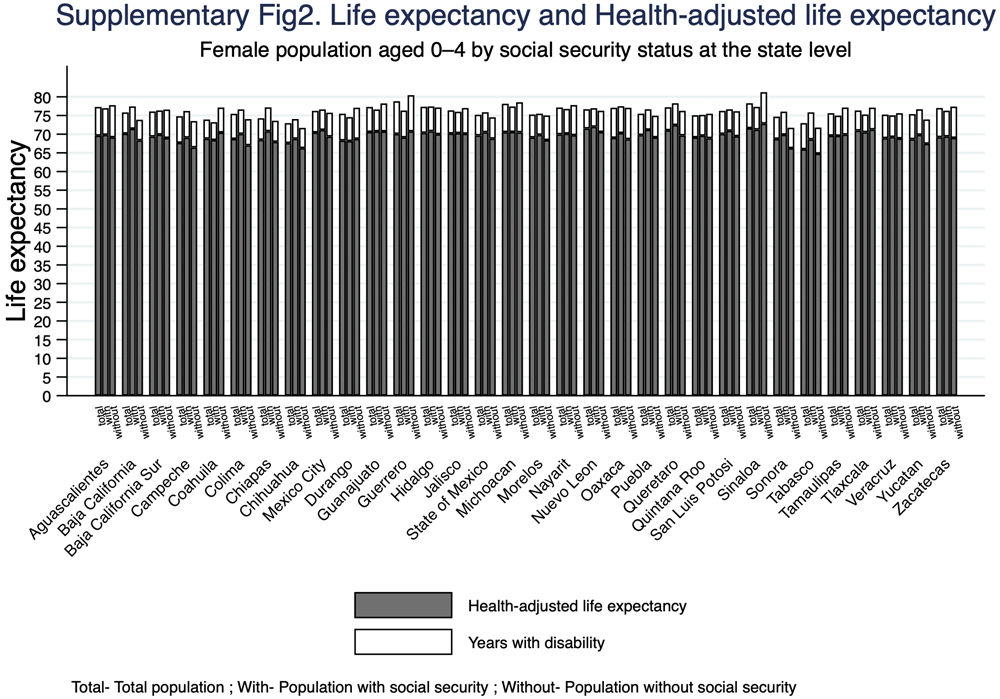
Figure 1 presents LE and HALE for the 0-4 age group, comparing populations with and without SS at the state level. The estimates reveal substantial heterogeneity across states. In almost all states, the SS group shows higher HALE than the non-SS group. Differences between both groups are more pronounced in states with lower HALE, whereas states with higher HALE display smaller gaps, suggesting more homogeneous outcomes and better overall health. The three states with the lowest HALE are Chihuahua, Tabasco, and Colima, while the highest values are observed in Sinaloa, Querétaro, and Nuevo León. Sex-disaggregated results are shown in Supplementary Figures 1 and 2; the pattern of larger differences between SS and non-SS groups in states with lower HALE is replicated for both sexes and is more pronounced among men.

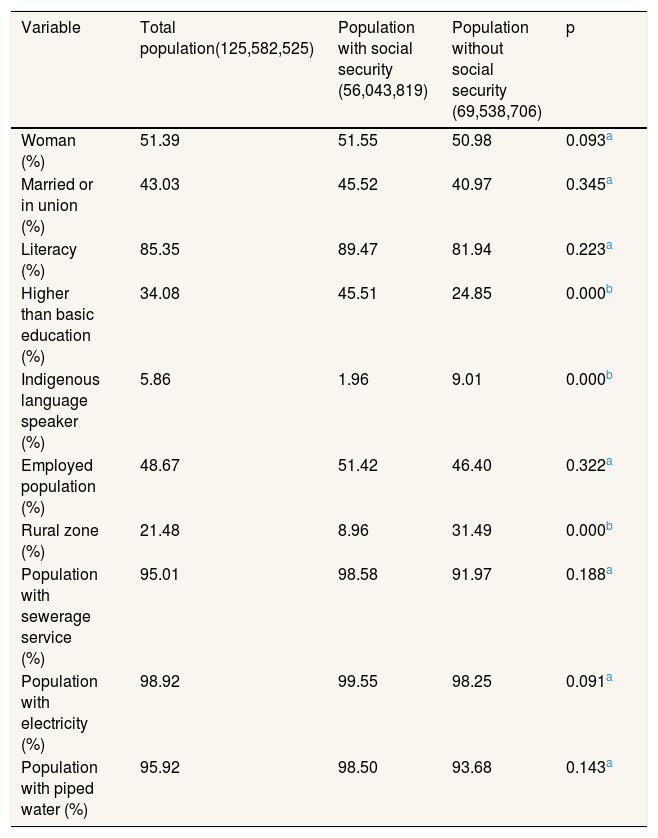
Table 2 shows the distribution of sociodemographic variables between the two populations. The population without SS had lower literacy rates, a lower proportion of groups with education higher than basic level, and lower levels of employment. This population also had a higher proportion of indigenous language speakers, was more likely to live in rural areas, and had lower access to sewerage services, electricity, and piped water. However, only education level, indigenous language speaker, and rural residence showed statistically significant differences between the two populations.
Distribution of sociodemographic variables for total population, and populations with and without social security.
| Variable | Total population(125,582,525) | Population with social security (56,043,819) | Population without social security (69,538,706) | p |
|---|---|---|---|---|
| Woman (%) | 51.39 | 51.55 | 50.98 | 0.093a |
| Married or in union (%) | 43.03 | 45.52 | 40.97 | 0.345a |
| Literacy (%) | 85.35 | 89.47 | 81.94 | 0.223a |
| Higher than basic education (%) | 34.08 | 45.51 | 24.85 | 0.000b |
| Indigenous language speaker (%) | 5.86 | 1.96 | 9.01 | 0.000b |
| Employed population (%) | 48.67 | 51.42 | 46.40 | 0.322a |
| Rural zone (%) | 21.48 | 8.96 | 31.49 | 0.000b |
| Population with sewerage service (%) | 95.01 | 98.58 | 91.97 | 0.188a |
| Population with electricity (%) | 98.92 | 99.55 | 98.25 | 0.091a |
| Population with piped water (%) | 95.92 | 98.50 | 93.68 | 0.143a |
Our research adds evidence on the role of health system institutional characteristics in population health outcomes in Mexico. To the best of the authors’ knowledge, this is the first study that compare LE and HALE by SS status. The main finding is that LE didn’t differ significantly between populations with and without SS, although persons with SS exhibited slightly higher LE at younger ages. However, this pattern changed when HALE was considered. In this case, statistically significant differences emerged, consistently favoring the population with SS. Given the lower HALE values observed among the population without SS, we suggest that the current organization of the Mexican health system –structured around SS affiliation– may contribute to the generation of health inequities.
An earlier analysis conducted in 2000 estimated LE at birth for the IMSS-insured population at 76.4 years,26 a value higher than the 74.7 years reported for the total Mexican population in the same year.27 Together with our findings, this evidence helps to clarify differences between these populations and contributes to resolving previously reported inconsistencies in health outcomes between populations with and without SS.17,18
The observed differences in HALE may be partly explained by the greater utilization of preventive services among SS-affiliated populations, including vaccination, screening programs, and routine laboratory check-ups, as well as more timely access to primary, secondary, and tertiary levels of healthcare. Such advantages may reduce delays in the diagnosis and treatment of potentially disabling and fatal conditions.28
However, these findings should be interpreted in light of the sociodemographic differences observed between populations with and without SS. Our analysis indicates that the population without SS experiences structural social disadvantage, suggesting that other SDH also play an important role in shaping the observed inequities, including education, ethnicity, and living conditions. These differences warrant further investigation.
Although there is a general consensus on the positive association between LE and HALE and various SDH,29 including access to health resources and preventive services,30 the relationship between health system characteristics and these outcomes is more complex than it appears. There is a critical need for in-depth analyses that explicitly link health system characteristics to population health outcomes, moving beyond the assumption that access to healthcare alone increases LE,31 as illustrated by our study. Some evidence supports this point. An analysis using data from the Organisation for Economic Co-operation and Development found that although increases in public health spending were associated with higher HALE at age 65, physician density per geographic area showed a negative association with HALE, suggesting that increases in LE and HALE are not necessarily linked to health resources. This may reflect the fact that a substantial proportion of medical services are delivered through private care, which is often associated with higher costs rather than better population health. This negative association was more pronounced for specialist physicians than for general practitioners, as a 10% increase in specialist density was associated with a reduction of 1.3 years in HALE.32
Although Mexico has implemented several health system reforms over the past two decades to expand healthcare access for populations outside the SS system, important differences persist between insured and uninsured populations that extend beyond mere access to health services. Consequently, a substantial proportion of Mexican population remain excluded from the full range of SS benefits.7
Inclusive institutions are strongly associated with national economic prosperity, as they promote equitable opportunities and enable a fairer distribution of resources.32 Norway provides a clear example, all citizens have unconditional access to social protection benefits, including high-quality healthcare grounded in a strong primary care system. The Norwegian health system is predominantly publicly financed, with approximately 86% of total health expenditure coming from public sources, the greatest proportion in Europe. As a result, Norway exhibits some of the highest levels of LE and HALE worldwide, alongside relatively small disparities across counties, reflecting a high degree of equity in these indicators.33
In contrast, when state institutions systematically segregate populations, inequities emerge across multiple domains, including the economy, education, employment, and health. Therefore, in our country, comprehensive structural reforms are urgently required to dismantle the long-standing division between populations with and without SS coverage, which continues to generate health inequities. Such reforms should involve a transition from a contributory social security model toward a universal social protection paradigm, in which the State guarantees a set of protection mechanisms for all citizens, regardless of their employment status or another characteristic.34 This shift would require modifications to the Mexican law Constitution, the integration of existing SS institutions, and their opening to the entire population. A long path to transit.
Finally, state-level findings indicated that the differences in LE and HALE between the two populations remained consistent despite substantial heterogeneity. This reflects Mexico's territorial diversity and the complex interplay of state-level contextual factors. Since the 1940s, economically advantaged states tend to concentrate in the northern and central regions, whereas poorer states have been located mainly in the south, characterized by higher illiteracy rates, limited access to basic public services, larger Indigenous populations, and greater geographic isolation.35 These contextual differences contribute to the persistence of marked variations in health status across states.
This study explores inequities in Mexico considering the SS status and using two impact indicators derived from quality data sources and employing a standardized and internationally comparable measure of disability based on the Washington Group approach. Nevertheless, several limitations should be acknowledged. First, mortality for 2020 was projected to avoid distortions caused by excess deaths attributable to COVID-19 and their impact on LE. While this strategy allowed us to assess the relationship between SS status and both LE and HALE without the confounding influence of the pandemic, the results should be interpreted with caution, as both indicators rely on projected rather than observed mortality data. Second, due to data availability constraints, affiliation with SS does not necessarily imply actual use of health services. Third, because this analysis relies on census data, it's not possible to determine the duration of persons’ affiliation with SS, as entitlement is closely linked to employment trajectories and may vary over the life course. Fourth, although conducting inferential analyses would have strengthened our results, this was not possible due to the lack of enough observations for such analyses. Future research should consider multivariate and longitudinal approaches to better understand variations in this outcomes, for example in the case of LE differences between populations with and without SS across younger and older age groups. Finally, although estimating life expectancy at birth would have been desirable, this was not feasible because birth records in Mexico do not distinguish whether newborns or their parents are affiliated with SS, preventing disaggregation by SS status at age zero.
ConclusionsLife expectancy didn’t differ significantly between populations with and without social security. However, the SS-affiliated population exhibited higher health-adjusted life expectancy, suggesting closer and more continuous contact with health services and a beneficial impact on functionality and quality of life across all age groups. Consequently, the current organization of the Mexican health system around social security affiliation may contribute to the generation of health inequities. Nevertheless, these findings should be interpreted considering the structural disadvantages experienced by populations without SS. Addressing these disparities requires substantial structural reforms and highlights the role of the health system as a key social determinant of health through which equity can be advanced.
Availability of databases and material for replicationMortality (https://www.inegi.org.mx/programas/edr/#microdatos) and disability data (https://www.inegi.org.mx/programas/ccpv/2020/) from the National Institute of Statistics and Geography can be found in its official website.
Evidence shows that there are differences in health resources and health outcomes between populations with and without social security coverage.
What does this study add to the literature?No significant differences were found in life expectancy between the two groups. However, the population with social security exhibited higher healthy-adjusted life expectancy than the population without social security.
What are the implications of the results?The organization of the Mexican health system around social security entitlement may contribute to the generation of health inequities.
Vanessa Santos.
Authorship contributionsH. García-Hernández: conception and design of the work, data collection, data analysis and interpretation, and drafting the article. G. Salinas-Escudero: conception and design of the work, data analysis and interpretation, and drafting the article. M. Agudelo-Botero: data analysis and interpretation and critical revision of the article. H. Reyes-Morales: conception or design of the work, drafting the article, and critical revision of the article.
A*c*kn*ow*ledgmentsThe authors thank the Secretaría de Ciencia, Humanidades, Tecnología e Innovación (SECIHTI) for awarding a scholarship to the doctoral student H. García-Hernández with CVU 1001868.
FundingNone.
Conflicts of interestNone.