


To analyse the individual and country-level determinants of the use of healthcare systems by populations over 50 years of age in Europe.
MethodWe conducted a cross-sectional study using data from Wave 7 (2017) of the Survey of Health, Ageing, and Retirement in Europe. The analysis included 27 countries. We fitted multilevel mixed-effects logistic regression models with hospitalization and doctor visits per person per year as dependent variables.
ResultsThe findings suggest that country-level variables explain between 3.3% and 4.9% of the differences in the likelihood of hospitalizations and approximately 10% of the likelihood of visiting a doctor at least once a year. Life expectancy and number of beds were the country-level variables most strongly associated with a reduced probability of hospitalization and doctor visits, respectively. The study also found that comorbidity and employment status were risk factors associated with hospitalization and doctor visits, while physical activity was a protective factor.
ConclusionsCountry-level factors positively associated with higher health service use are the number of beds, health expenditure per capita and preventable mortality. Life expectancy and treatable mortality are negatively associated with the use of these services. Greater comorbidity increase the likelihood of hospitalization and medical visits, while higher muscular strength or regular physical activity reduce them.
Analizar los determinantes individuales y de cada país asociados al uso de los sistemas sanitarios por parte de la población mayor de 50 años en Europa.
MétodoEstudio transversal utilizando datos de la ola 7 (2017) de la Survey of Health, Aging, and Retirement in Europe. Se incluyeron 27 países y se realizaron modelos de regresión logística multinivel con efectos mixtos. Las variables dependientes fueron la hospitalización y las visitas médicas por persona y por año.
ResultadosLos hallazgos sugieren que las variables de país explican entre el 3,3% y el 4,9% de las diferencias en la probabilidad de hospitalizaciones, y aproximadamente el 10% de la probabilidad de visitar a un médico al menos una vez al año. La esperanza de vida y el número de camas fueron las variables que más se asociaron con una menor probabilidad de hospitalización y visitas al médico. La comorbilidad y la situación laboral fueron factores de riesgo de la hospitalización, y las visitas al médico y la actividad física fueron un factor protector.
ConclusionesLos factores de país asociados positivamente a un mayor uso de servicios sanitarios son el número de camas, el gasto en salud per cápita y la mortalidad prevenible. La esperanza de vida y la mortalidad tratable están negativamente asociadas al uso de estos servicios. Una mayor comorbilidad aumenta la probabilidad de hospitalización y consultas médicas, mientras que una mayor fuerza muscular y la práctica de actividad física la reducen.
Most European countries generally have good health outcomes. However, they organize and finance their healthcare systems in different ways,1 with there being disparities between them; the difference, for example, between the lowest and highest life expectancy is more than 8 years.2 Meanwhile, although one of the common goals in European health policy is universal access to quality healthcare at an affordable cost, population ageing creates a higher demand for health services and can impact healthcare utilization.3
Several models exist in the literature to analyse healthcare utilization;4 however, that proposed by Andersen,5 along with its variations, is the most widespread.6,7 The most current and comprehensive version of the model shows that healthcare service utilization is determined by context, that is, social circumstances and environment, and by individual characteristics, health behaviours and outcomes. Hospitalization is an indicator of health status that is sufficiently serious to limit the performance of daily life activities. Several factors may determine an individual's hospitalization rate: genetic and congenital factors, individual, socioeconomic and lifestyle factors and the country or region of residence.
In addition, the European Commission concludes that inhabitants of countries with a lower socioeconomic level have significant difficulties in accessing health care,8 thus delaying diagnoses and enhancing the risk of hospitalization and readmission.9 This situation increases the costs of health services,10–12 and leads to inequities. Consequently, better alignment of both competences and funding of primary care centres might reduce the need for unnecessary hospital admissions, prevent avoidable readmissions and limit inappropriate use of emergency care.13
A previous study examined the socioeconomic and lifestyle factors related to both the cost and frequency of hospitalization of older adults in Europe.14 However, there are differences that cannot be explained exclusively by social gradient or lifestyle. Thus, it is reasonable to suppose that the health structures of a country or region are determinants that help maintain improvements in the health status of the population in the long term, reducing or even avoiding hospitalizations and allowing healthcare resources to be saved or more efficiently allocated. Focusing on how these and other structural conditions interact with the use of health services in older adults is key for decision makers and could fill what is, to the best of our knowledge, a gap in the literature.
Hence, the aim of this study is to analyse the individual and country-level determinants associated with the use of healthcare systems in European countries, focusing on the population aged over 50 years, thereby filling the abovementioned gap in the literature.
MethodDataWe drew upon the data collected in Wave 7 of the Survey of Health, Ageing and Retirement in Europe (SHARE), which started in March 2017 and ended on 31 October 2017.15–17 We included the information on 27 countries. The design of this study is cross-sectional. Additionally, we used data from the Eurostat, the World Health Organization and the Organization for Economic Co-operation and Development (OECD) databases to obtain the macroeconomic and structural variables (country-level variables) that are described later in this section.
Dependent variablesThe main dependent variables in our analysis were hospitalization and doctor visits per person and year. The survey includes a question on how many times the respondent has been admitted to a hospital for at least one night in the last 12 months. We dichotomized the variable to study the probability of using this health service or not.
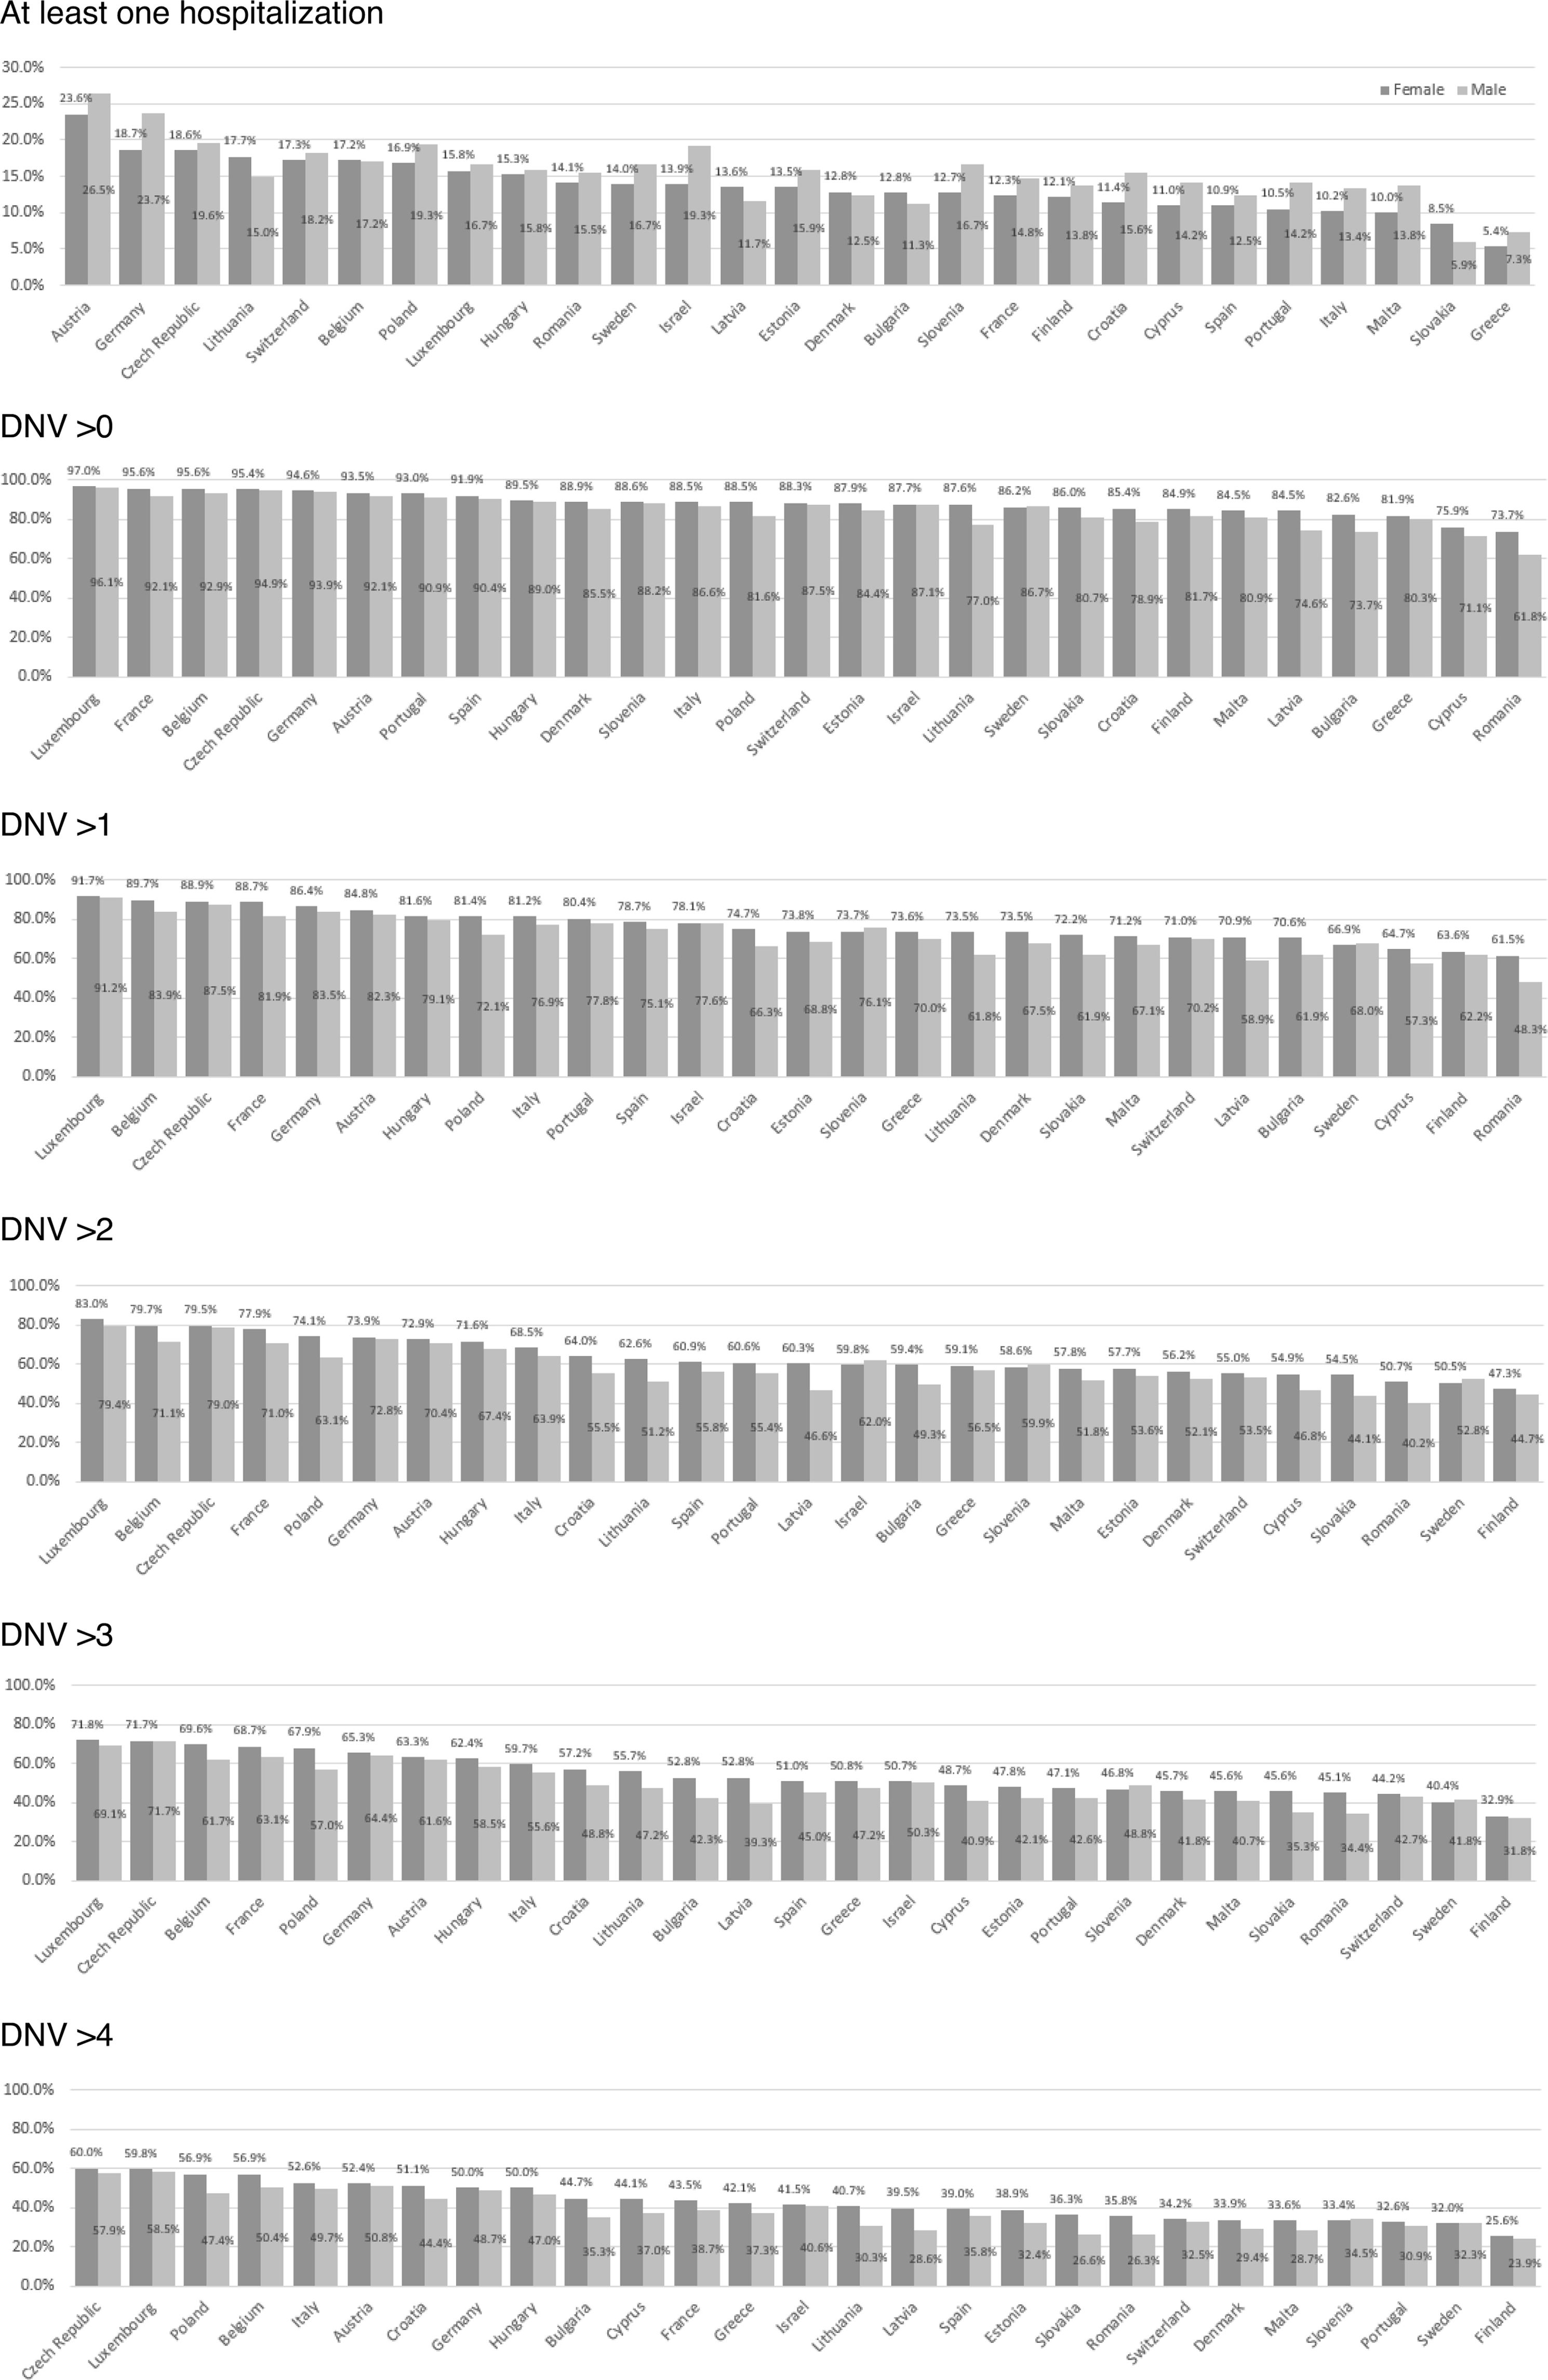
Regarding doctor visits, the survey enquired about the total number of times the respondent had seen or talked to a medical doctor or qualified nurse about their health in the last 12 months, including emergency room and outpatient clinic visits. We call this variable “doctor or nursing visits” (DNV). The distribution of the variable was skewed: 87.6% of people had visited the doctor/nurse at least once in the year, 75.9% more than once, 62.6% more than two times, 53.5% more than three times and 42.3% more than four times. For this reason, we considered building various models using each of these thresholds as a dependent variable —visits above 0, 1, 2, 3 or 4. This is because DNV are not always for a health problem, but also for prevention, obtaining information, resolving doubts, etc.; even for mild health problems, there are people that use DNV and others that do not.18
Independent variablesWe included sociodemographic, lifestyle, health condition and economic variables using SHARE and other sources. From the SHARE, we obtained sex, age, marital status, chronic diseases —which we categorized as no comorbidities, medium (1-3) and high (>3), education in years and income, employment status, area of residence (large city or large town, rural or small town, suburbs), moderate physical activity and vigorous physical activity (more than once a week, once a week, one to three times a month) and the maximum measure of grip strength (maxgrip) as an indicator of muscular strength (log transformed). Total household net income was adjusted for purchasing power parity (PPP), using Germany as reference country, with the PPP being taken from the SHARE.
Additionally, we included the following country-level variables: preventable mortality, treatable mortality, at risk of poverty and/or exclusion rate (AROPE rate), life expectancy (at birth), current health expenditure per capita (PPP), number of hospital beds (per 100,000 inhabitants), and household out-of-pocket payments on curative and rehabilitative care and on long-term care and medical goods (% total current health expenditure). As Wave 7 of SHARE was conducted for 2017, the data used for the country-level variables in this article refer to 2017 or 2018, or the latest available data until 2018 (see Tables S1 and S2 in Supplementary Material). All these data were mean centred for better interpretation.
StatisticsWe performed a descriptive analysis to determine the main characteristics of the sample, while the differences between sex were studied using χ2 tests. Since sex-related differences were found in the dependent variables, which is consistent with the literature,19 we carried out the main analyses separately.
Given the nature of the data and our aims, we drew on fitted multilevel mixed-effects logistic regression models. We fitted three models for each dependent variable: 1) model 1 was the null model (no independent variables); 2) model 2 contained only the independent variables at the individual level; and 3) model 3 contained both the individual-level variables and the country-level variables. Thus, in defining the model, we considered two levels in which there were M clusters of countries conditional on uj random effects, such that:
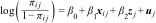
For j = 1,…, M countries and i = 1,…, nj individuals in each country, πij the likelihood of individual i in country j having been hospitalized or having visited a doctor at least once, xij a vector of covariables for the individual-level effects and zj for the country-level effects, β0 the intercept, β1 the vector of fixed-effect coefficients of individual-level variables and β2 fixed-effect coefficients of country-level variables. uj represents random effects for the jth country. The variance partition coefficient was used to measure the proportion of the total residual variance resulting from differences between countries. The data were cleaned using R 4.4.0, and statistical analysis was performed using STATA 17.
ResultsFigure 1 and Tables S3 and S4 in Supplementary Material present the descriptive statistics by gender and country. Regarding the dependent variables, for women, the mean percentage by country for at least one hospitalization was, on average, 13.7%; for men, it was 15.4%. The average number of women who visited the doctor at least once in the last year was 88.1%; for men, it was 84.5%. Table S5 in Supplementary Material shows that, regarding the type of health system (Bismarck or Beveridge), people without comorbidity present a higher use of doctor visits in countries with the Beveridge model, but a lower use of hospitalization; when there are comorbidities, Bismarck model countries present both a higher use of hospitalization and visits to doctors. Additional descriptive information can be found in Figures S1-S3 in Supplementary Material.

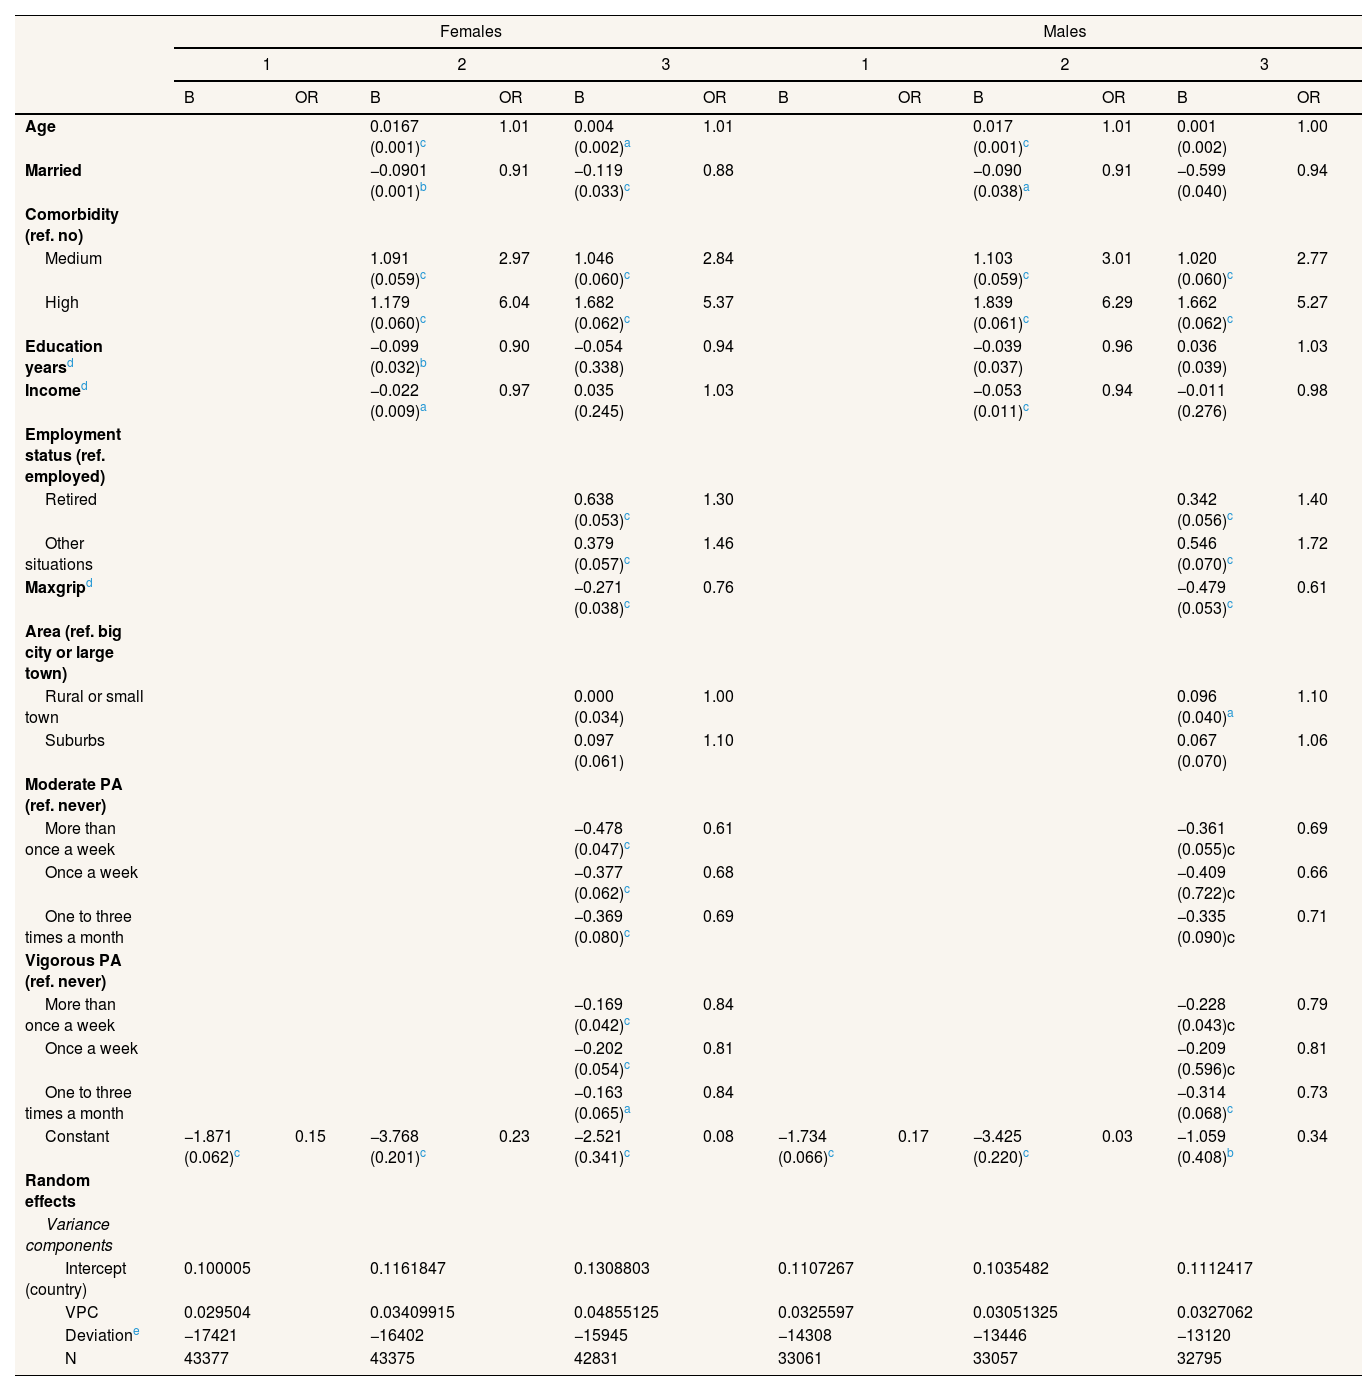
Table 1 includes the multilevel logit models with the dependent variable “Having been hospitalized at least once” in the last year. These are presented for women and men separately, with the individual-level variables (level 1) and the intercept as the country-level variable (level 2) being included as independent variables According to the variance partition coefficient (VPC), which measures the proportion of the total residual variance due to between-group variation, up to 4.85% of the variation in hospitalization is associated with country-related factors for women and 3.27% for men. The protective factors, in order of importance, are moderate physical activity, muscle strength, vigorous physical activity and, additionally, in the case of women, being married. Meanwhile, the number of comorbidities was the largest predictor of hospitalization, followed by being retired or in other employment situations versus being actively employed.
Multilevel logit models with a dependent variable of at least one hospitalization in the last year.
| Females | Males | |||||||||||
|---|---|---|---|---|---|---|---|---|---|---|---|---|
| 1 | 2 | 3 | 1 | 2 | 3 | |||||||
| B | OR | B | OR | B | OR | B | OR | B | OR | B | OR | |
| Age | 0.0167 (0.001)c | 1.01 | 0.004 (0.002)a | 1.01 | 0.017 (0.001)c | 1.01 | 0.001 (0.002) | 1.00 | ||||
| Married | −0.0901 (0.001)b | 0.91 | −0.119 (0.033)c | 0.88 | −0.090 (0.038)a | 0.91 | −0.599 (0.040) | 0.94 | ||||
| Comorbidity (ref. no) | ||||||||||||
| Medium | 1.091 (0.059)c | 2.97 | 1.046 (0.060)c | 2.84 | 1.103 (0.059)c | 3.01 | 1.020 (0.060)c | 2.77 | ||||
| High | 1.179 (0.060)c | 6.04 | 1.682 (0.062)c | 5.37 | 1.839 (0.061)c | 6.29 | 1.662 (0.062)c | 5.27 | ||||
| Education yearsd | −0.099 (0.032)b | 0.90 | −0.054 (0.338) | 0.94 | −0.039 (0.037) | 0.96 | 0.036 (0.039) | 1.03 | ||||
| Incomed | −0.022 (0.009)a | 0.97 | 0.035 (0.245) | 1.03 | −0.053 (0.011)c | 0.94 | −0.011 (0.276) | 0.98 | ||||
| Employment status (ref. employed) | ||||||||||||
| Retired | 0.638 (0.053)c | 1.30 | 0.342 (0.056)c | 1.40 | ||||||||
| Other situations | 0.379 (0.057)c | 1.46 | 0.546 (0.070)c | 1.72 | ||||||||
| Maxgripd | −0.271 (0.038)c | 0.76 | −0.479 (0.053)c | 0.61 | ||||||||
| Area (ref. big city or large town) | ||||||||||||
| Rural or small town | 0.000 (0.034) | 1.00 | 0.096 (0.040)a | 1.10 | ||||||||
| Suburbs | 0.097 (0.061) | 1.10 | 0.067 (0.070) | 1.06 | ||||||||
| Moderate PA (ref. never) | ||||||||||||
| More than once a week | −0.478 (0.047)c | 0.61 | −0.361 (0.055)c | 0.69 | ||||||||
| Once a week | −0.377 (0.062)c | 0.68 | −0.409 (0.722)c | 0.66 | ||||||||
| One to three times a month | −0.369 (0.080)c | 0.69 | −0.335 (0.090)c | 0.71 | ||||||||
| Vigorous PA (ref. never) | ||||||||||||
| More than once a week | −0.169 (0.042)c | 0.84 | −0.228 (0.043)c | 0.79 | ||||||||
| Once a week | −0.202 (0.054)c | 0.81 | −0.209 (0.596)c | 0.81 | ||||||||
| One to three times a month | −0.163 (0.065)a | 0.84 | −0.314 (0.068)c | 0.73 | ||||||||
| Constant | −1.871 (0.062)c | 0.15 | −3.768 (0.201)c | 0.23 | −2.521 (0.341)c | 0.08 | −1.734 (0.066)c | 0.17 | −3.425 (0.220)c | 0.03 | −1.059 (0.408)b | 0.34 |
| Random effects | ||||||||||||
| Variance components | ||||||||||||
| Intercept (country) | 0.100005 | 0.1161847 | 0.1308803 | 0.1107267 | 0.1035482 | 0.1112417 | ||||||
| VPC | 0.029504 | 0.03409915 | 0.04855125 | 0.0325597 | 0.03051325 | 0.0327062 | ||||||
| Deviatione | −17421 | −16402 | −15945 | −14308 | −13446 | −13120 | ||||||
| N | 43377 | 43375 | 42831 | 33061 | 33057 | 32795 | ||||||
Maxgrip: maximum measure of grip strength. OR: odds ratio; PA: physical activity; VPC: variance partition coefficient.
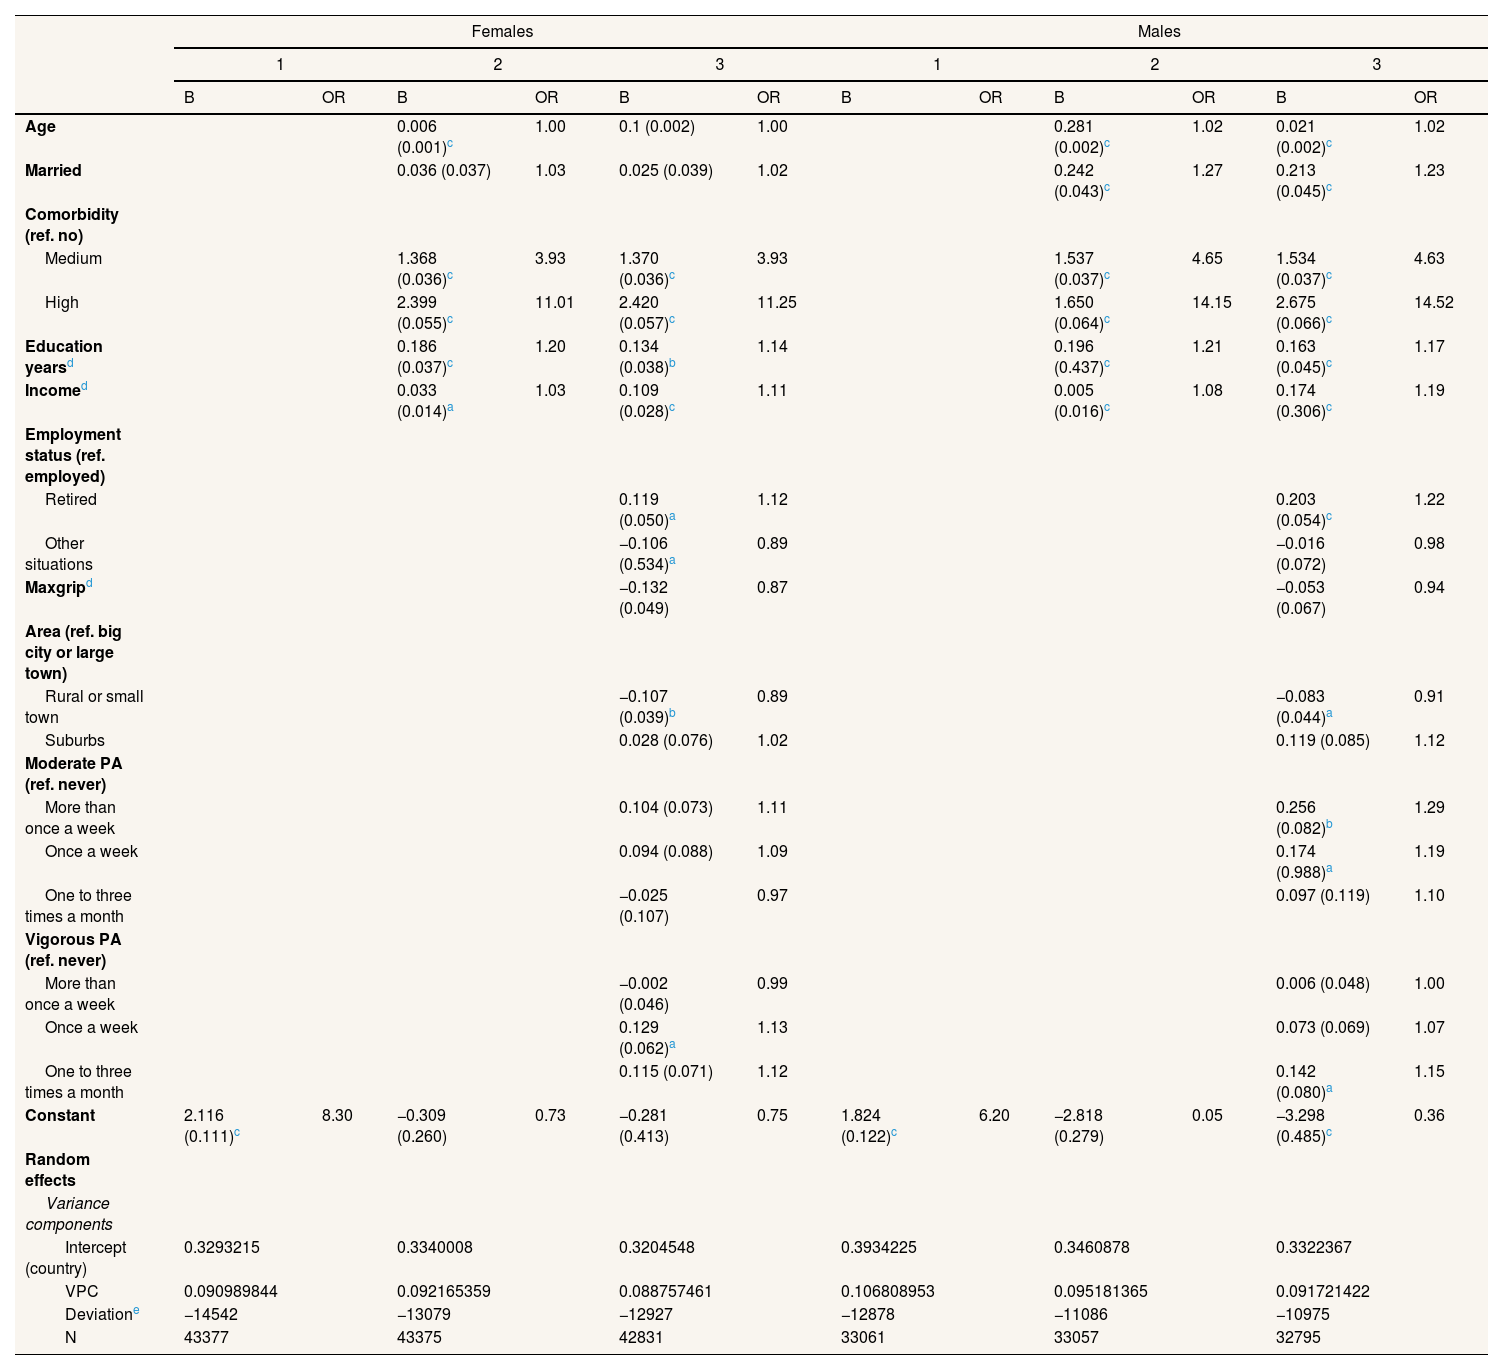
Table 2 shows the results for the multilevel logit models with at least one visit to a doctor a year as dependent variable. In this case, the VPC reveals higher differences between countries, ranging from 9.8% to 10.6%, depending on the model. Differences can be noted in the likelihood of hospitalizations after adjusting for comorbidities. In this case, educational level and income are positively associated, with age and marital status being positively associated in men. Being retired vs. being employed is also positively associated. Living in a rural or small town vs. big city or large town, is negatively associated in women.
Multilevel logit models with a dependent variable of at least one visit to a doctor in the last year.
| Females | Males | |||||||||||
|---|---|---|---|---|---|---|---|---|---|---|---|---|
| 1 | 2 | 3 | 1 | 2 | 3 | |||||||
| B | OR | B | OR | B | OR | B | OR | B | OR | B | OR | |
| Age | 0.006 (0.001)c | 1.00 | 0.1 (0.002) | 1.00 | 0.281 (0.002)c | 1.02 | 0.021 (0.002)c | 1.02 | ||||
| Married | 0.036 (0.037) | 1.03 | 0.025 (0.039) | 1.02 | 0.242 (0.043)c | 1.27 | 0.213 (0.045)c | 1.23 | ||||
| Comorbidity (ref. no) | ||||||||||||
| Medium | 1.368 (0.036)c | 3.93 | 1.370 (0.036)c | 3.93 | 1.537 (0.037)c | 4.65 | 1.534 (0.037)c | 4.63 | ||||
| High | 2.399 (0.055)c | 11.01 | 2.420 (0.057)c | 11.25 | 1.650 (0.064)c | 14.15 | 2.675 (0.066)c | 14.52 | ||||
| Education yearsd | 0.186 (0.037)c | 1.20 | 0.134 (0.038)b | 1.14 | 0.196 (0.437)c | 1.21 | 0.163 (0.045)c | 1.17 | ||||
| Incomed | 0.033 (0.014)a | 1.03 | 0.109 (0.028)c | 1.11 | 0.005 (0.016)c | 1.08 | 0.174 (0.306)c | 1.19 | ||||
| Employment status (ref. employed) | ||||||||||||
| Retired | 0.119 (0.050)a | 1.12 | 0.203 (0.054)c | 1.22 | ||||||||
| Other situations | −0.106 (0.534)a | 0.89 | −0.016 (0.072) | 0.98 | ||||||||
| Maxgripd | −0.132 (0.049) | 0.87 | −0.053 (0.067) | 0.94 | ||||||||
| Area (ref. big city or large town) | ||||||||||||
| Rural or small town | −0.107 (0.039)b | 0.89 | −0.083 (0.044)a | 0.91 | ||||||||
| Suburbs | 0.028 (0.076) | 1.02 | 0.119 (0.085) | 1.12 | ||||||||
| Moderate PA (ref. never) | ||||||||||||
| More than once a week | 0.104 (0.073) | 1.11 | 0.256 (0.082)b | 1.29 | ||||||||
| Once a week | 0.094 (0.088) | 1.09 | 0.174 (0.988)a | 1.19 | ||||||||
| One to three times a month | −0.025 (0.107) | 0.97 | 0.097 (0.119) | 1.10 | ||||||||
| Vigorous PA (ref. never) | ||||||||||||
| More than once a week | −0.002 (0.046) | 0.99 | 0.006 (0.048) | 1.00 | ||||||||
| Once a week | 0.129 (0.062)a | 1.13 | 0.073 (0.069) | 1.07 | ||||||||
| One to three times a month | 0.115 (0.071) | 1.12 | 0.142 (0.080)a | 1.15 | ||||||||
| Constant | 2.116 (0.111)c | 8.30 | −0.309 (0.260) | 0.73 | −0.281 (0.413) | 0.75 | 1.824 (0.122)c | 6.20 | −2.818 (0.279) | 0.05 | −3.298 (0.485)c | 0.36 |
| Random effects | ||||||||||||
| Variance components | ||||||||||||
| Intercept (country) | 0.3293215 | 0.3340008 | 0.3204548 | 0.3934225 | 0.3460878 | 0.3322367 | ||||||
| VPC | 0.090989844 | 0.092165359 | 0.088757461 | 0.106808953 | 0.095181365 | 0.091721422 | ||||||
| Deviatione | −14542 | −13079 | −12927 | −12878 | −11086 | −10975 | ||||||
| N | 43377 | 43375 | 42831 | 33061 | 33057 | 32795 | ||||||
Maxgrip: maximum measure of grip strength. OR: odds ratio; PA: physical activity; VPC: variance partition coefficient.
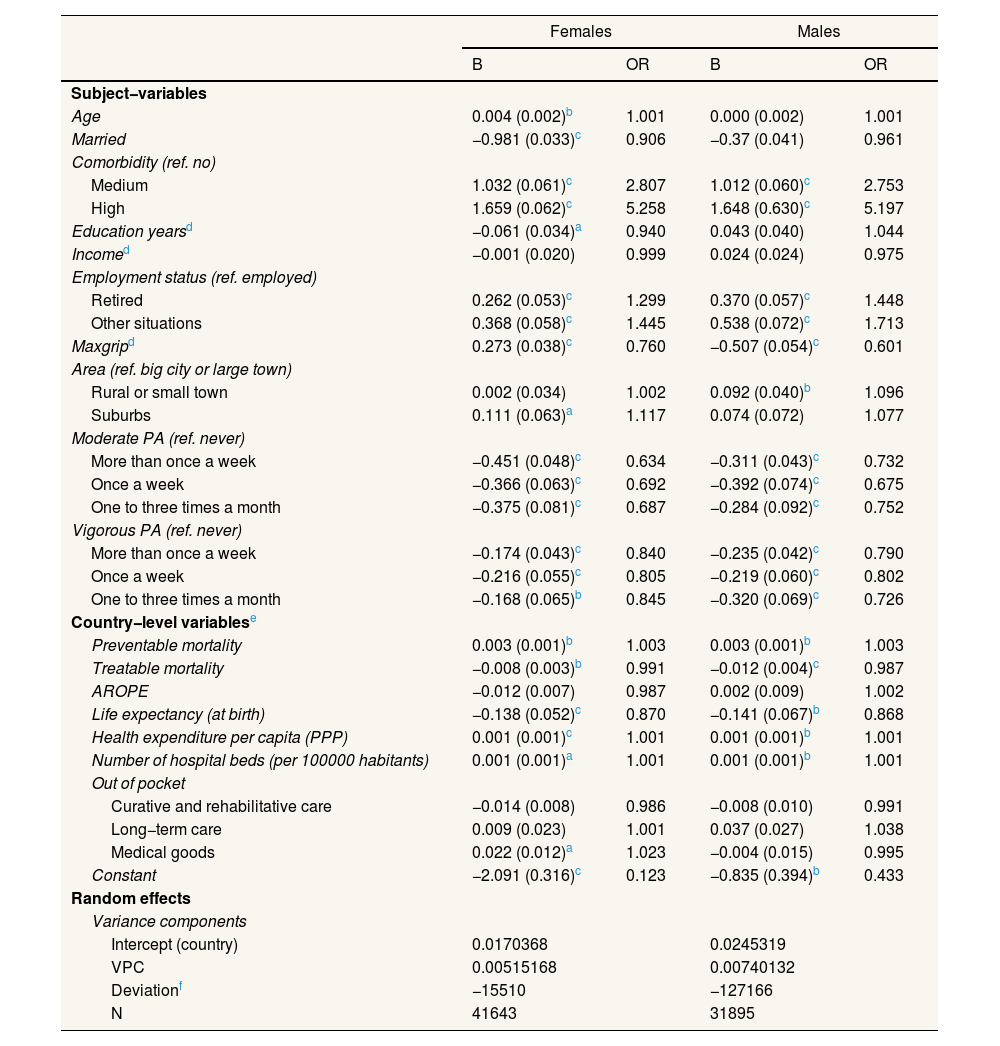
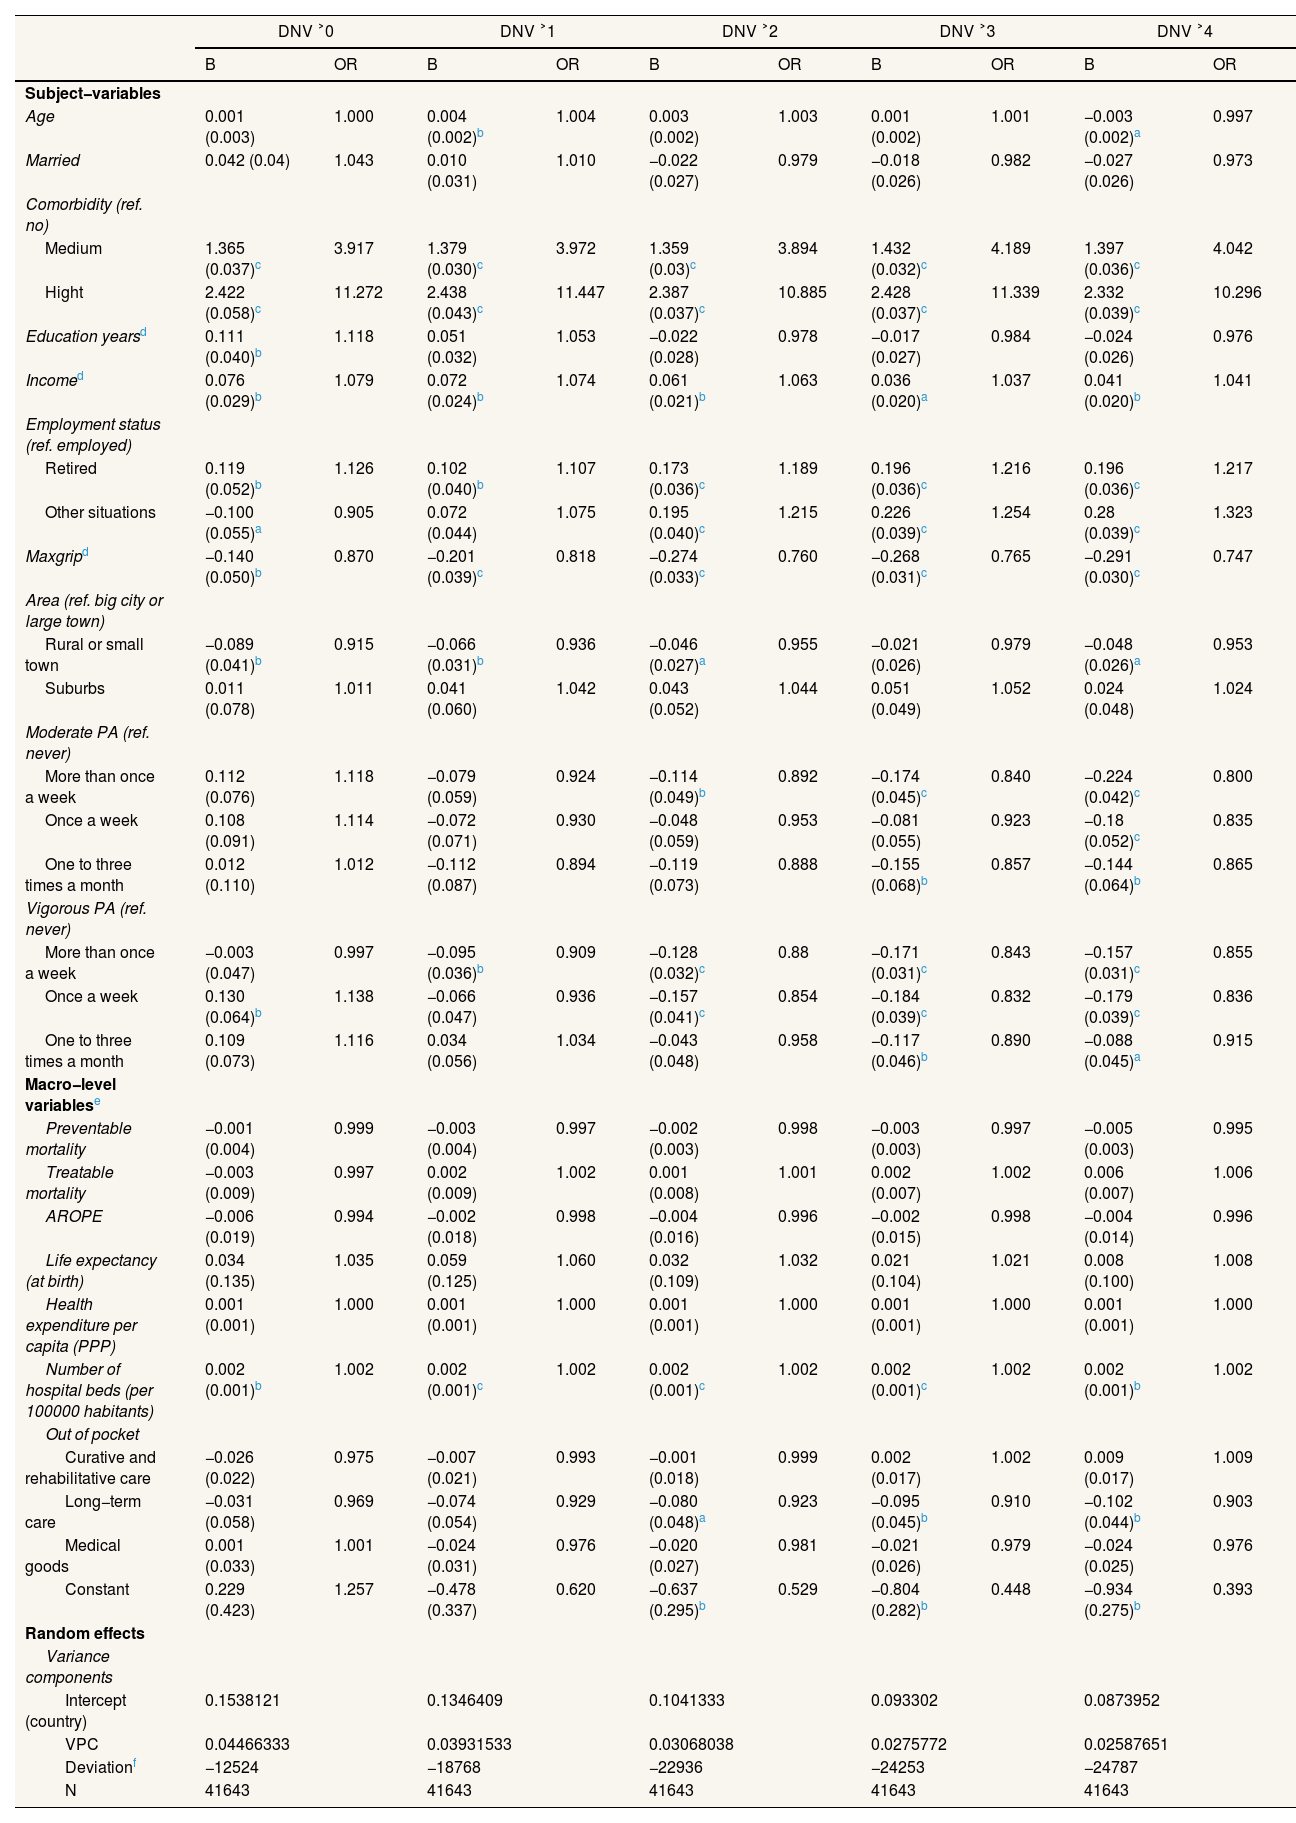
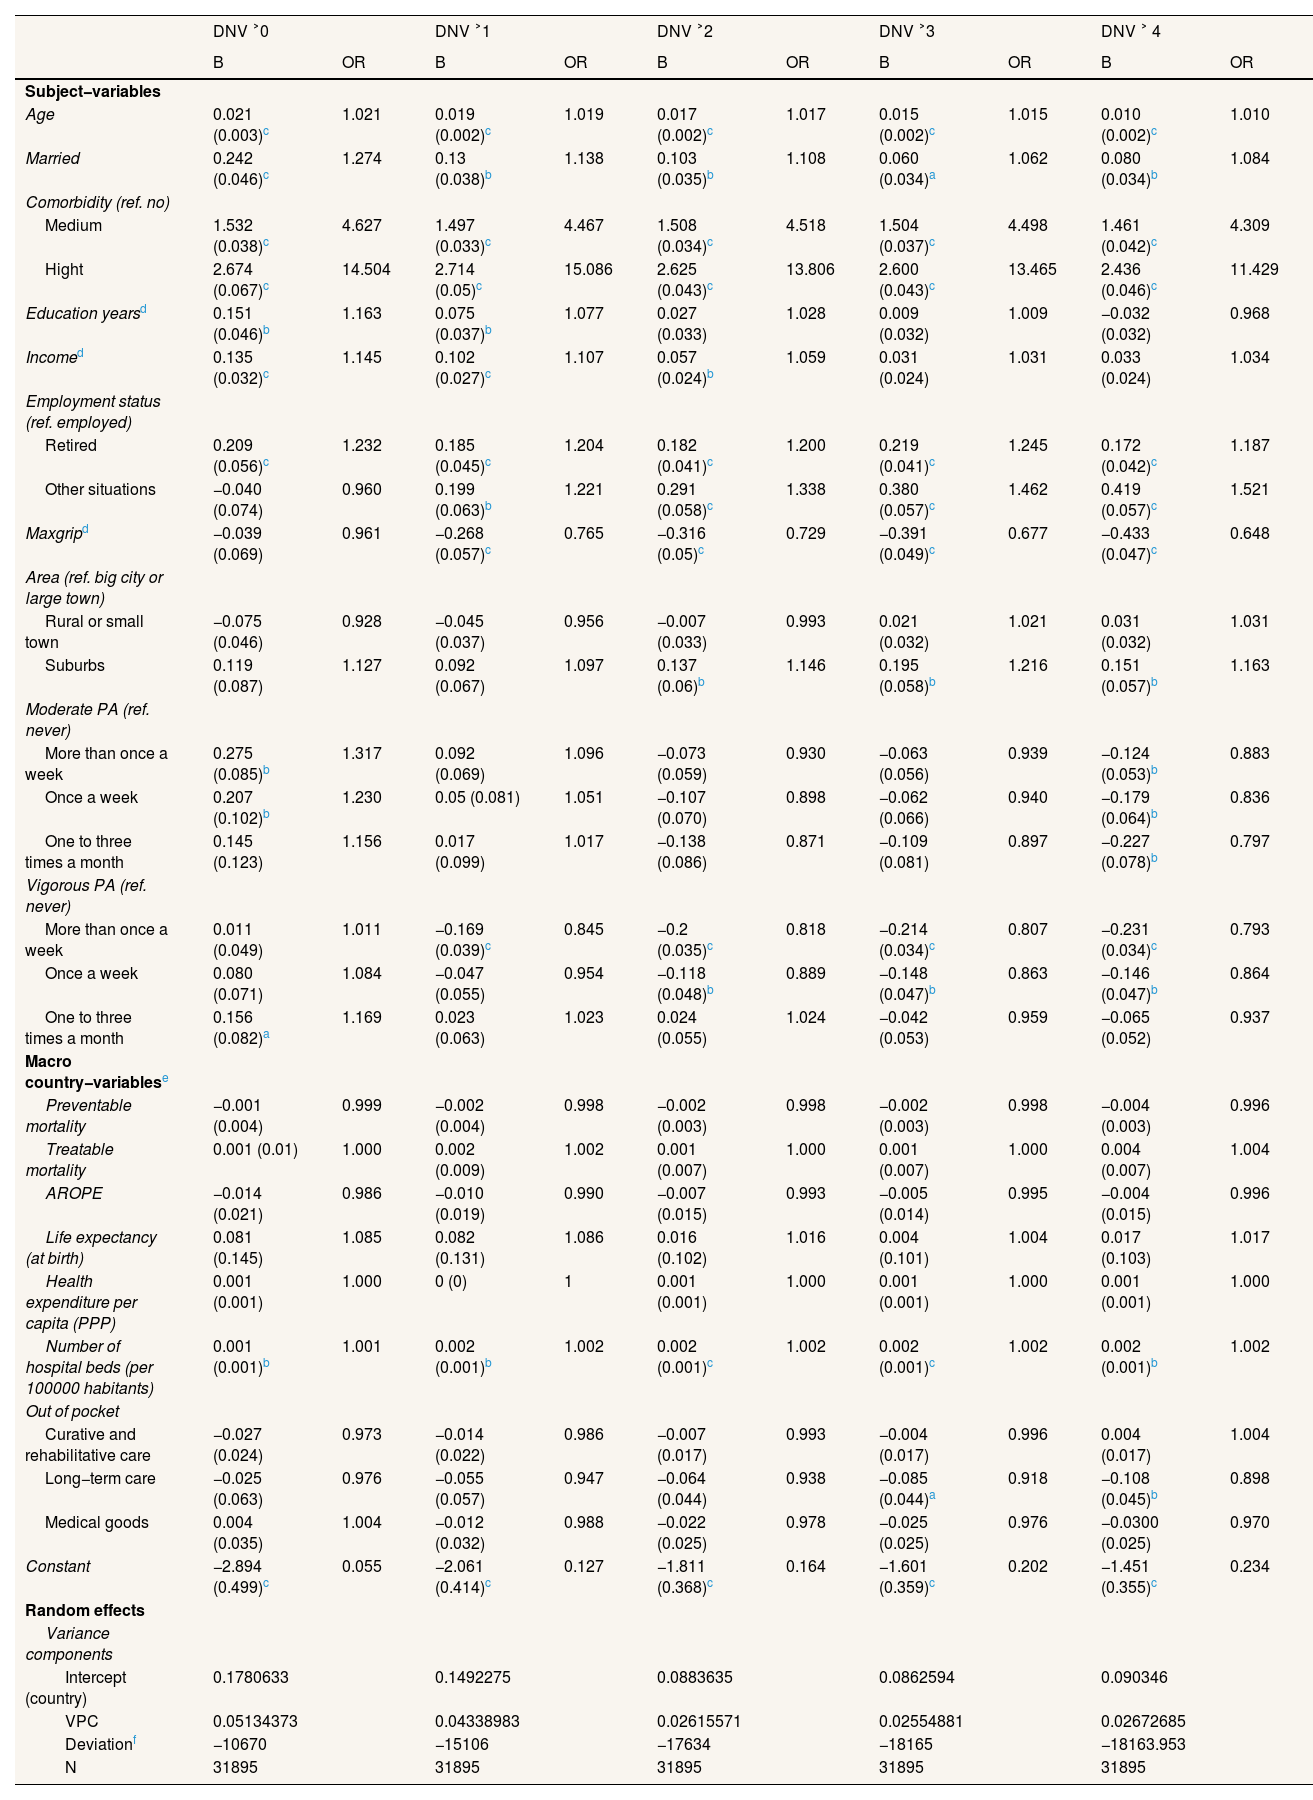
Tables 3–5 show how including country-level variables affects the multilevel models. On the one hand, when country-level variables are included in the models with the dependent variable of hospitalizations, the VPC decreases noticeably, which indicates that they efficiently capture the effect of the variation between countries. The most important indicator was life expectancy at birth: residents of countries with lower life expectancies present a higher risk of hospitalization. Physical activity and muscle strength are protective factors; comorbidities and not being employed are risk factors. Health expenditure is also positively associated with hospitalizations. On the other hand, the models with the dependent variable of DNV at different levels present contrasting relationships. The most significant country-level variable was the number of hospital beds for both men and women and for all categories of the dependent variable: individuals in countries above the mean number of hospital beds (494.83 per 100,000 inhabitants) have a slightly increased likelihood of visiting a doctor. Regarding the individual variables, the main differences between the models for women and those for men are age and being married. While these are not significant variables in the case of women, for men, they are risk factors in the likelihood of DNV. Comorbidity remains the most significant factor in increased risk, followed by being retired versus being employed and income. Living in a rural area or small town (in women) or suburbs (in men) and moderate or vigorous physical activity are negatively associated with DNV.
Multilevel logit models with a dependent variable of at least one hospitalization in the last year, including country-level variables.
| Females | Males | |||
|---|---|---|---|---|
| B | OR | B | OR | |
| Subject−variables | ||||
| Age | 0.004 (0.002)b | 1.001 | 0.000 (0.002) | 1.001 |
| Married | −0.981 (0.033)c | 0.906 | −0.37 (0.041) | 0.961 |
| Comorbidity (ref. no) | ||||
| Medium | 1.032 (0.061)c | 2.807 | 1.012 (0.060)c | 2.753 |
| High | 1.659 (0.062)c | 5.258 | 1.648 (0.630)c | 5.197 |
| Education yearsd | −0.061 (0.034)a | 0.940 | 0.043 (0.040) | 1.044 |
| Incomed | −0.001 (0.020) | 0.999 | 0.024 (0.024) | 0.975 |
| Employment status (ref. employed) | ||||
| Retired | 0.262 (0.053)c | 1.299 | 0.370 (0.057)c | 1.448 |
| Other situations | 0.368 (0.058)c | 1.445 | 0.538 (0.072)c | 1.713 |
| Maxgripd | 0.273 (0.038)c | 0.760 | −0.507 (0.054)c | 0.601 |
| Area (ref. big city or large town) | ||||
| Rural or small town | 0.002 (0.034) | 1.002 | 0.092 (0.040)b | 1.096 |
| Suburbs | 0.111 (0.063)a | 1.117 | 0.074 (0.072) | 1.077 |
| Moderate PA (ref. never) | ||||
| More than once a week | −0.451 (0.048)c | 0.634 | −0.311 (0.043)c | 0.732 |
| Once a week | −0.366 (0.063)c | 0.692 | −0.392 (0.074)c | 0.675 |
| One to three times a month | −0.375 (0.081)c | 0.687 | −0.284 (0.092)c | 0.752 |
| Vigorous PA (ref. never) | ||||
| More than once a week | −0.174 (0.043)c | 0.840 | −0.235 (0.042)c | 0.790 |
| Once a week | −0.216 (0.055)c | 0.805 | −0.219 (0.060)c | 0.802 |
| One to three times a month | −0.168 (0.065)b | 0.845 | −0.320 (0.069)c | 0.726 |
| Country−level variablese | ||||
| Preventable mortality | 0.003 (0.001)b | 1.003 | 0.003 (0.001)b | 1.003 |
| Treatable mortality | −0.008 (0.003)b | 0.991 | −0.012 (0.004)c | 0.987 |
| AROPE | −0.012 (0.007) | 0.987 | 0.002 (0.009) | 1.002 |
| Life expectancy (at birth) | −0.138 (0.052)c | 0.870 | −0.141 (0.067)b | 0.868 |
| Health expenditure per capita (PPP) | 0.001 (0.001)c | 1.001 | 0.001 (0.001)b | 1.001 |
| Number of hospital beds (per 100000 habitants) | 0.001 (0.001)a | 1.001 | 0.001 (0.001)b | 1.001 |
| Out of pocket | ||||
| Curative and rehabilitative care | −0.014 (0.008) | 0.986 | −0.008 (0.010) | 0.991 |
| Long−term care | 0.009 (0.023) | 1.001 | 0.037 (0.027) | 1.038 |
| Medical goods | 0.022 (0.012)a | 1.023 | −0.004 (0.015) | 0.995 |
| Constant | −2.091 (0.316)c | 0.123 | −0.835 (0.394)b | 0.433 |
| Random effects | ||||
| Variance components | ||||
| Intercept (country) | 0.0170368 | 0.0245319 | ||
| VPC | 0.00515168 | 0.00740132 | ||
| Deviationf | −15510 | −127166 | ||
| N | 41643 | 31895 | ||
AROPE: at risk of poverty or exclusion rate; Maxgrip: maximum measure of grip strength; OR: odds ratio; PA: physical activity; PPP: purchasing power parity. VPC: variance partition coefficient.
Multilevel logit model for female doctor or nursing visit.
| DNV ˃0 | DNV ˃1 | DNV ˃2 | DNV ˃3 | DNV ˃4 | ||||||
|---|---|---|---|---|---|---|---|---|---|---|
| B | OR | B | OR | B | OR | B | OR | B | OR | |
| Subject−variables | ||||||||||
| Age | 0.001 (0.003) | 1.000 | 0.004 (0.002)b | 1.004 | 0.003 (0.002) | 1.003 | 0.001 (0.002) | 1.001 | −0.003 (0.002)a | 0.997 |
| Married | 0.042 (0.04) | 1.043 | 0.010 (0.031) | 1.010 | −0.022 (0.027) | 0.979 | −0.018 (0.026) | 0.982 | −0.027 (0.026) | 0.973 |
| Comorbidity (ref. no) | ||||||||||
| Medium | 1.365 (0.037)c | 3.917 | 1.379 (0.030)c | 3.972 | 1.359 (0.03)c | 3.894 | 1.432 (0.032)c | 4.189 | 1.397 (0.036)c | 4.042 |
| Hight | 2.422 (0.058)c | 11.272 | 2.438 (0.043)c | 11.447 | 2.387 (0.037)c | 10.885 | 2.428 (0.037)c | 11.339 | 2.332 (0.039)c | 10.296 |
| Education yearsd | 0.111 (0.040)b | 1.118 | 0.051 (0.032) | 1.053 | −0.022 (0.028) | 0.978 | −0.017 (0.027) | 0.984 | −0.024 (0.026) | 0.976 |
| Incomed | 0.076 (0.029)b | 1.079 | 0.072 (0.024)b | 1.074 | 0.061 (0.021)b | 1.063 | 0.036 (0.020)a | 1.037 | 0.041 (0.020)b | 1.041 |
| Employment status (ref. employed) | ||||||||||
| Retired | 0.119 (0.052)b | 1.126 | 0.102 (0.040)b | 1.107 | 0.173 (0.036)c | 1.189 | 0.196 (0.036)c | 1.216 | 0.196 (0.036)c | 1.217 |
| Other situations | −0.100 (0.055)a | 0.905 | 0.072 (0.044) | 1.075 | 0.195 (0.040)c | 1.215 | 0.226 (0.039)c | 1.254 | 0.28 (0.039)c | 1.323 |
| Maxgripd | −0.140 (0.050)b | 0.870 | −0.201 (0.039)c | 0.818 | −0.274 (0.033)c | 0.760 | −0.268 (0.031)c | 0.765 | −0.291 (0.030)c | 0.747 |
| Area (ref. big city or large town) | ||||||||||
| Rural or small town | −0.089 (0.041)b | 0.915 | −0.066 (0.031)b | 0.936 | −0.046 (0.027)a | 0.955 | −0.021 (0.026) | 0.979 | −0.048 (0.026)a | 0.953 |
| Suburbs | 0.011 (0.078) | 1.011 | 0.041 (0.060) | 1.042 | 0.043 (0.052) | 1.044 | 0.051 (0.049) | 1.052 | 0.024 (0.048) | 1.024 |
| Moderate PA (ref. never) | ||||||||||
| More than once a week | 0.112 (0.076) | 1.118 | −0.079 (0.059) | 0.924 | −0.114 (0.049)b | 0.892 | −0.174 (0.045)c | 0.840 | −0.224 (0.042)c | 0.800 |
| Once a week | 0.108 (0.091) | 1.114 | −0.072 (0.071) | 0.930 | −0.048 (0.059) | 0.953 | −0.081 (0.055) | 0.923 | −0.18 (0.052)c | 0.835 |
| One to three times a month | 0.012 (0.110) | 1.012 | −0.112 (0.087) | 0.894 | −0.119 (0.073) | 0.888 | −0.155 (0.068)b | 0.857 | −0.144 (0.064)b | 0.865 |
| Vigorous PA (ref. never) | ||||||||||
| More than once a week | −0.003 (0.047) | 0.997 | −0.095 (0.036)b | 0.909 | −0.128 (0.032)c | 0.88 | −0.171 (0.031)c | 0.843 | −0.157 (0.031)c | 0.855 |
| Once a week | 0.130 (0.064)b | 1.138 | −0.066 (0.047) | 0.936 | −0.157 (0.041)c | 0.854 | −0.184 (0.039)c | 0.832 | −0.179 (0.039)c | 0.836 |
| One to three times a month | 0.109 (0.073) | 1.116 | 0.034 (0.056) | 1.034 | −0.043 (0.048) | 0.958 | −0.117 (0.046)b | 0.890 | −0.088 (0.045)a | 0.915 |
| Macro−level variablese | ||||||||||
| Preventable mortality | −0.001 (0.004) | 0.999 | −0.003 (0.004) | 0.997 | −0.002 (0.003) | 0.998 | −0.003 (0.003) | 0.997 | −0.005 (0.003) | 0.995 |
| Treatable mortality | −0.003 (0.009) | 0.997 | 0.002 (0.009) | 1.002 | 0.001 (0.008) | 1.001 | 0.002 (0.007) | 1.002 | 0.006 (0.007) | 1.006 |
| AROPE | −0.006 (0.019) | 0.994 | −0.002 (0.018) | 0.998 | −0.004 (0.016) | 0.996 | −0.002 (0.015) | 0.998 | −0.004 (0.014) | 0.996 |
| Life expectancy (at birth) | 0.034 (0.135) | 1.035 | 0.059 (0.125) | 1.060 | 0.032 (0.109) | 1.032 | 0.021 (0.104) | 1.021 | 0.008 (0.100) | 1.008 |
| Health expenditure per capita (PPP) | 0.001 (0.001) | 1.000 | 0.001 (0.001) | 1.000 | 0.001 (0.001) | 1.000 | 0.001 (0.001) | 1.000 | 0.001 (0.001) | 1.000 |
| Number of hospital beds (per 100000 habitants) | 0.002 (0.001)b | 1.002 | 0.002 (0.001)c | 1.002 | 0.002 (0.001)c | 1.002 | 0.002 (0.001)c | 1.002 | 0.002 (0.001)b | 1.002 |
| Out of pocket | ||||||||||
| Curative and rehabilitative care | −0.026 (0.022) | 0.975 | −0.007 (0.021) | 0.993 | −0.001 (0.018) | 0.999 | 0.002 (0.017) | 1.002 | 0.009 (0.017) | 1.009 |
| Long−term care | −0.031 (0.058) | 0.969 | −0.074 (0.054) | 0.929 | −0.080 (0.048)a | 0.923 | −0.095 (0.045)b | 0.910 | −0.102 (0.044)b | 0.903 |
| Medical goods | 0.001 (0.033) | 1.001 | −0.024 (0.031) | 0.976 | −0.020 (0.027) | 0.981 | −0.021 (0.026) | 0.979 | −0.024 (0.025) | 0.976 |
| Constant | 0.229 (0.423) | 1.257 | −0.478 (0.337) | 0.620 | −0.637 (0.295)b | 0.529 | −0.804 (0.282)b | 0.448 | −0.934 (0.275)b | 0.393 |
| Random effects | ||||||||||
| Variance components | ||||||||||
| Intercept (country) | 0.1538121 | 0.1346409 | 0.1041333 | 0.093302 | 0.0873952 | |||||
| VPC | 0.04466333 | 0.03931533 | 0.03068038 | 0.0275772 | 0.02587651 | |||||
| Deviationf | −12524 | −18768 | −22936 | −24253 | −24787 | |||||
| N | 41643 | 41643 | 41643 | 41643 | 41643 | |||||
AROPE: at risk of poverty or exclusion rate; DNV: doctor or nursing visit; Maxgrip: maximum measure of grip strength; OR: odds ratio; PA: physical activity; PPP: purchasing power parity. VPC: variance partition coefficient.
Multilevel logit model for male doctor or nursing visit.
| DNV ˃0 | DNV ˃1 | DNV ˃2 | DNV ˃3 | DNV ˃ 4 | ||||||
|---|---|---|---|---|---|---|---|---|---|---|
| B | OR | B | OR | B | OR | B | OR | B | OR | |
| Subject−variables | ||||||||||
| Age | 0.021 (0.003)c | 1.021 | 0.019 (0.002)c | 1.019 | 0.017 (0.002)c | 1.017 | 0.015 (0.002)c | 1.015 | 0.010 (0.002)c | 1.010 |
| Married | 0.242 (0.046)c | 1.274 | 0.13 (0.038)b | 1.138 | 0.103 (0.035)b | 1.108 | 0.060 (0.034)a | 1.062 | 0.080 (0.034)b | 1.084 |
| Comorbidity (ref. no) | ||||||||||
| Medium | 1.532 (0.038)c | 4.627 | 1.497 (0.033)c | 4.467 | 1.508 (0.034)c | 4.518 | 1.504 (0.037)c | 4.498 | 1.461 (0.042)c | 4.309 |
| Hight | 2.674 (0.067)c | 14.504 | 2.714 (0.05)c | 15.086 | 2.625 (0.043)c | 13.806 | 2.600 (0.043)c | 13.465 | 2.436 (0.046)c | 11.429 |
| Education yearsd | 0.151 (0.046)b | 1.163 | 0.075 (0.037)b | 1.077 | 0.027 (0.033) | 1.028 | 0.009 (0.032) | 1.009 | −0.032 (0.032) | 0.968 |
| Incomed | 0.135 (0.032)c | 1.145 | 0.102 (0.027)c | 1.107 | 0.057 (0.024)b | 1.059 | 0.031 (0.024) | 1.031 | 0.033 (0.024) | 1.034 |
| Employment status (ref. employed) | ||||||||||
| Retired | 0.209 (0.056)c | 1.232 | 0.185 (0.045)c | 1.204 | 0.182 (0.041)c | 1.200 | 0.219 (0.041)c | 1.245 | 0.172 (0.042)c | 1.187 |
| Other situations | −0.040 (0.074) | 0.960 | 0.199 (0.063)b | 1.221 | 0.291 (0.058)c | 1.338 | 0.380 (0.057)c | 1.462 | 0.419 (0.057)c | 1.521 |
| Maxgripd | −0.039 (0.069) | 0.961 | −0.268 (0.057)c | 0.765 | −0.316 (0.05)c | 0.729 | −0.391 (0.049)c | 0.677 | −0.433 (0.047)c | 0.648 |
| Area (ref. big city or large town) | ||||||||||
| Rural or small town | −0.075 (0.046) | 0.928 | −0.045 (0.037) | 0.956 | −0.007 (0.033) | 0.993 | 0.021 (0.032) | 1.021 | 0.031 (0.032) | 1.031 |
| Suburbs | 0.119 (0.087) | 1.127 | 0.092 (0.067) | 1.097 | 0.137 (0.06)b | 1.146 | 0.195 (0.058)b | 1.216 | 0.151 (0.057)b | 1.163 |
| Moderate PA (ref. never) | ||||||||||
| More than once a week | 0.275 (0.085)b | 1.317 | 0.092 (0.069) | 1.096 | −0.073 (0.059) | 0.930 | −0.063 (0.056) | 0.939 | −0.124 (0.053)b | 0.883 |
| Once a week | 0.207 (0.102)b | 1.230 | 0.05 (0.081) | 1.051 | −0.107 (0.070) | 0.898 | −0.062 (0.066) | 0.940 | −0.179 (0.064)b | 0.836 |
| One to three times a month | 0.145 (0.123) | 1.156 | 0.017 (0.099) | 1.017 | −0.138 (0.086) | 0.871 | −0.109 (0.081) | 0.897 | −0.227 (0.078)b | 0.797 |
| Vigorous PA (ref. never) | ||||||||||
| More than once a week | 0.011 (0.049) | 1.011 | −0.169 (0.039)c | 0.845 | −0.2 (0.035)c | 0.818 | −0.214 (0.034)c | 0.807 | −0.231 (0.034)c | 0.793 |
| Once a week | 0.080 (0.071) | 1.084 | −0.047 (0.055) | 0.954 | −0.118 (0.048)b | 0.889 | −0.148 (0.047)b | 0.863 | −0.146 (0.047)b | 0.864 |
| One to three times a month | 0.156 (0.082)a | 1.169 | 0.023 (0.063) | 1.023 | 0.024 (0.055) | 1.024 | −0.042 (0.053) | 0.959 | −0.065 (0.052) | 0.937 |
| Macro country−variablese | ||||||||||
| Preventable mortality | −0.001 (0.004) | 0.999 | −0.002 (0.004) | 0.998 | −0.002 (0.003) | 0.998 | −0.002 (0.003) | 0.998 | −0.004 (0.003) | 0.996 |
| Treatable mortality | 0.001 (0.01) | 1.000 | 0.002 (0.009) | 1.002 | 0.001 (0.007) | 1.000 | 0.001 (0.007) | 1.000 | 0.004 (0.007) | 1.004 |
| AROPE | −0.014 (0.021) | 0.986 | −0.010 (0.019) | 0.990 | −0.007 (0.015) | 0.993 | −0.005 (0.014) | 0.995 | −0.004 (0.015) | 0.996 |
| Life expectancy (at birth) | 0.081 (0.145) | 1.085 | 0.082 (0.131) | 1.086 | 0.016 (0.102) | 1.016 | 0.004 (0.101) | 1.004 | 0.017 (0.103) | 1.017 |
| Health expenditure per capita (PPP) | 0.001 (0.001) | 1.000 | 0 (0) | 1 | 0.001 (0.001) | 1.000 | 0.001 (0.001) | 1.000 | 0.001 (0.001) | 1.000 |
| Number of hospital beds (per 100000 habitants) | 0.001 (0.001)b | 1.001 | 0.002 (0.001)b | 1.002 | 0.002 (0.001)c | 1.002 | 0.002 (0.001)c | 1.002 | 0.002 (0.001)b | 1.002 |
| Out of pocket | ||||||||||
| Curative and rehabilitative care | −0.027 (0.024) | 0.973 | −0.014 (0.022) | 0.986 | −0.007 (0.017) | 0.993 | −0.004 (0.017) | 0.996 | 0.004 (0.017) | 1.004 |
| Long−term care | −0.025 (0.063) | 0.976 | −0.055 (0.057) | 0.947 | −0.064 (0.044) | 0.938 | −0.085 (0.044)a | 0.918 | −0.108 (0.045)b | 0.898 |
| Medical goods | 0.004 (0.035) | 1.004 | −0.012 (0.032) | 0.988 | −0.022 (0.025) | 0.978 | −0.025 (0.025) | 0.976 | −0.0300 (0.025) | 0.970 |
| Constant | −2.894 (0.499)c | 0.055 | −2.061 (0.414)c | 0.127 | −1.811 (0.368)c | 0.164 | −1.601 (0.359)c | 0.202 | −1.451 (0.355)c | 0.234 |
| Random effects | ||||||||||
| Variance components | ||||||||||
| Intercept (country) | 0.1780633 | 0.1492275 | 0.0883635 | 0.0862594 | 0.090346 | |||||
| VPC | 0.05134373 | 0.04338983 | 0.02615571 | 0.02554881 | 0.02672685 | |||||
| Deviationf | −10670 | −15106 | −17634 | −18165 | −18163.953 | |||||
| N | 31895 | 31895 | 31895 | 31895 | 31895 |
AROPE: at risk of poverty or exclusion rate; DNV: doctor or nursing visit; Maxgrip: maximum measure of grip strength; OR: odds ratio; PA: physical activity; PPP: purchasing power parity. VPC: variance partition coefficient.
The main aim of this paper was to study the differences in the use of healthcare services across European countries at individual and country-level. Our findings suggest that despite the differences —and some similarities— between the 27 countries under analysis, there is no substantial disparity according to hospitalizations, with the rate being between 3.27 and 4.85%. Moreover, looking at the citizens that had been to the doctor at least once, the differences due to the functioning/structure or idiosyncrasy of an individual's country of residence rise to between 9.8% and 10%. The country-level variable with the greatest association with the probability of hospitalization was life expectancy, as a protective factor, considering the small deviation in this indicator among countries. This variable can be a proxy for a structurally strong health systems in which small differences have an important impact: it is a crucial variable to assess the efficiency of health systems,20 and it is a context indicator —related to GDP per capita, education, etc.21
As a person ages, they are more prone to develop chronic diseases and to present health complications that may require hospital treatment.22 Our findings do not associate a longer life expectancy with a higher risk of hospitalization; rather, life expectancy is inversely associated with the risk of hospitalization. This coincides with the results of other studies,23,24 which suggest that people expected to live longer are healthier. These disparate results may also be attributed to the existence of other socioeconomic and lifestyle factors affecting the risk of hospitalization.
Healthy lifestyle habits foster health and well-being, reducing the risk of chronic diseases, cardiovascular disease, stroke, infectious diseases and other conditions that may require hospitalization. Our study shows that engaging in both vigorous and moderate physical activity and having greater muscle strength are associated with a reduced risk of hospitalization. These findings are consistent with those of a previous study in European countries,14 which found that both individuals with good muscle strength and those engaging in vigorous or moderate physical activity more than once a week significantly reduced the likelihood of hospitalization. In other words, the literature has shown that an adequate level of physical activity in older adults reduces healthcare service utilization and improves health outcomes.25–28Age is an important factor in terms of comorbidity. The literature shows that the older a person is, the more likely they are to develop chronic diseases,29 functional disabilities and other health problems.22 In our study, at the individual level, the number of comorbidities is the main factor associated with the risk of hospitalization, since, as the probability of presenting complications because of these comorbidities rises, so do the number of hospital admissions and days of hospitalization.9,30
Regarding the models analysing DNV according to gender, our results show that married men are more likely to go to the doctor. In the literature, we found studies suggesting that wives are often more concerned about their spouses’ health and encourage them to have regular check-ups and look after their health. Furthermore, our study was conducted in a population of over 50-year-olds, in which women no longer visit the primary care doctor for gynaecological/obstetric reasons. Various studies have reported results that run counter to ours, as they suggest that women accumulate more visits to the doctor in primary care,31,32 although it is true that the risk of such visits declines with age.33 Studies have also suggested that gender is a variable with little predictive power for primary care utilization.31 These diverse findings underline that awareness of gender-related differences in health should be fostered.34
Furthermore, given the evident internal differences in Europe with respect to funding and organization of financing, organization of primary care and the relationships between the different levels, there is interest in evaluating the factors that affect visits to the doctor at macro level. In the present study, the most meaningful macro-level variable was the number of hospital beds —for both models, men and women. This variable can be understood as a proxy for the strength of infrastructures, where arguably, if one system has a larger number of beds than another, it might also have a more developed level of primary care (better financed and managed health centres). In this sense, our findings are consistent with those of other studies,35 reporting that the number of hospital beds and the number of doctors have a positive impact on health, such that the number of visits to the doctor are reduced. Furthermore, these variables have a positive effect on a population's life expectancy,36 reducing the number of visits to the doctor. On the other hand, this association could also mean that demand is induced by supply; however, a different study design might be needed to confirm this explanation.
As with the risk of hospitalization, the number of comorbidities continues to be the variable with the greatest association with DNV. Multimorbidity complicates primary care,37 as its treatment requires more tests and procedures in doctor's offices and more time spent with the patient.38
LimitationsThis study has some limitations that should be considered. Firstly, the SHARE uses self-reported information. Such information can lead to bias; this kind of data, however, when used in large scale population studies may be an acceptable method.39 Secondly, as in other similar studies,39 the study design is cross-sectional, and the results should thus be understood in terms of associations between variables rather than causal relationships. Future research focusing on this topic is recommended to use a longitudinal approach. Nonetheless, the cross-sectional design approach using the SHARE was advantageous in retaining a greater number of countries in the study, as merging waves can result in a loss of country sample. In addition, subsequent research should examine issues of reverse causality and whether there is demand induced by the supply. It might also include an evaluation of the cost of the services across countries.
ConclusionsThis study provides evidence on individual and country-level determinants associated with the use of health care systems in Europe. Of the country-level variables, the number of hospital beds, health expenditure per capita and preventable mortality are positively associated with the likelihood of hospitalization, while treatable mortality and life expectancy are negatively associated. The number of hospital beds is positively associated with the likelihood of visiting a doctor. In terms of individual characteristics, a larger number of comorbidities is positively associated with both the likelihood of being hospitalized and visiting a doctor or nurse, while a higher level of muscular strength or engaging in physical activity is negatively associated.
Availability of databases and material for replicationThe data used comes from the anonymized and public accessible SHARE (https://share-eric.eu/) database as well as other public sources in the case of macro variables. The datasets used and/or analysed during the current study are available from the corresponding author on reasonable request.
In an ageing population, healthcare use is associated with individual circumstances or social gradient and lifestyle related factors, affecting both cost and frequency of hospitalizations. There are differences which cannot be explained only at individual level.
What does this study add to the literature?This study shows that country-level characteristics, determinants or structural determinants explain variations in the use of healthcare services. Life expectancy, number of beds and health expenditure are associated with the use of healthcare services.
What are the implications of the results?Focusing on the individual level is important in developing public policies and health policies that guarantee equality and equity between different groups, but a structural view, focusing on material conditions in health systems, is necessary to improve policies.
The corresponding author, on behalf of the other authors guarantee the accuracy, transparency and honesty of the data and information contained in the study, that no relevant information has been omitted and that all discrepancies between authors have been adequately resolved and described.
Authorship contributionsE. Amo-Saus and I. Pardo-García conceived the idea for the study and wrote the initial draft of the paper. R. Martínez-Lacoba and P. Moya-Martínez collected the data and performed the analyses. All authors contributed to the debate, critical writing and final revision of the manuscript. All authors approve the final version of the paper.
AcknowledgementsThe authors thank all the comments that we have received from editors, reviewers, and colleagues during the publication process of this work.
FundingThis work was supported by the project SBPLY/21/180501/000066 of the Regional Government of Castilla-La Mancha and ERDF and Project 2023- GRIN-34431-Funding of Research Group “Economía, Alimentación y Sociedad” of Universidad de Castilla-La Mancha.
Conflicts of interestNone.


