


The 3rd International Nursing and Health Sciences Students and Health Care Professionals Conference (INHSP)
Más datosThe control room A and B employees are a high risk of benzene exposure, because they work close to the waste pit which is a source of benzene. This study is to analyze the magnitude of the health risk of benzene exposure to all employees.
MethodsThe data of this study were obtained from interviews and the results of environmental quality of PT X. Data were analyzed using Environmental Health Risk Analysis (EHRA) method which compared with RfC for non-carcinogenic effects and CSF for carcinogenic effects.
ResultsThe results of individual calculations for the non-carcinogenic and carcinogenic effect of benzene are at a dangerous level in both real time and lifetime exposure.
ConclusionsIn the calculation of carcinogenic and non-carcinogenic risk exposure in real time, half the populations are at risk of being affected and in lifetime the entire populations are at risk of being exposed to these effects.
Naturally, benzene comes from crude oil. For example benzene, found at concentrations up to 4g/L in petroleum content, is also found in seawater with concentrations up to 0.8ppb in the vicinity of natural gas and petroleum storage.1 Measurement of benzene exposure for a population is quite difficult to quantify because the lifestyle of each individual varies widely, environmental weather conditions can also affect, and the environment in which they live varies.2
Workers in industries that make or use benzene such as petrochemicals, petroleum refining, coal mining, tire manufacturing, benzene storage and distribution, fuel storage and distribution can be exposed to high levels. Other occupations that have the potential to be exposed to benzene are workers working in coal furnaces in the steel industry, printing, shoe factories, laboratory technicians, firefighters, and gas station operators.3
The effects of acute exposure to high levels of benzene (to nerves, skin, respiration, and digestion) can occur immediately after exposure. Neurological effects due to the anesthetic nature of benzene which directly attacks the central nervous system/preceded by feelings of drift, depression, and if exposure to high levels of benzene continues, it can cause death. The effects of moderate concentrations of benzene exposure can cause headaches, dizziness, nausea, dizziness, and eye burning. The effects of continued exposure can cause tremors, shortness of breath, confusion, loss of consciousness, coma, and death.4
In Indonesia, standards have been established for the determination of the threshold value (NAV) for physical and chemical factors in the workplace. In the Regulation of the Minister of Manpower of the Republic of Indonesia No. 5 of 2018 concerning Work Safety in the Work Environment stipulates that benzene is included in group A1 or a chemical substance that is proven to have a carcinogenic health effect for humans with a threshold value (TLV) of 0.5ppm for 8h of exposure. Meanwhile, for a short exposure for 15min of 2.5ppm.5
MethodsStudy designThe study design will use a risk analysis method which is taken from the following 3 steps: first is a risk analysis consisting of hazard identification, exposure analysis, dose–response analysis, and risk characteristics, second is risk management, and the last is risk communication which is carried out to assess and predict what will happen due to exposure to hazardous substances that can harm workers, in this case, benzene.1
Data collectionThis type of research is a descriptive study using quantitative analysis methods. This research begins by collecting secondary data related to the work process which includes chemicals in the work area, material safety data sheets (MSDS) for these materials, and the number of workers involved in this work. Then the authors collected primary data related to body weight and then what symptoms were felt during work and what PPE was used during work, frequency of exposure, time of exposure, duration of employee exposure to benzene with the help of questionnaires and interviews with several workers. As well as assistance from the 2018 industrial hygiene report as secondary data to determine the concentration of benzene in control room A and B.
Data analysisThe data processing that will be carried out is by comparing the research results (intake values) that have been obtained from workers with a reference concentration value (RfC) which is safe for exposure to non-carcinogenic effects and cancer slope factor (CSF) for carcinogenic effects. However, this data processing comes from two sources, namely primary data and secondary data. Thus, data processing can provide significant results. Then perform engineering to reduce exposure and concentration of benzene.4
States that an adverse health impact on an organism, system, or (sub) population caused by exposure to an agent in the amount and with a certain pathway of exposure is called risk. There is another argument that states that OSH risk is a combination and the possibility of a hazardous event or exposure occurring with the severity of the injury or health problems caused by the event or exposure. Meanwhile, risk management is a business process to manage/control the risks that exist in every work activity.3
In making risk management, what must be done is to make a risk analysis. Risk analysis is a process for controlling situations where the object of research may be exposed to danger. There are 3 components in risk analysis, namely first is risk assessment, second is risk management, and last is risk communication.6
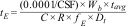
Exposure assessment is an evaluation of the exposure of an organism, system, or sub (population) to an agent. In this analysis, identification of the dose or amount of risk agent received by a person (intake) is carried out through inhalation (respiratory tract). Intake (intake) is the amount of intake received by an individual per body weight per day. This intake data can use this equation as follows7:
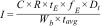
With:
I: intake/intake (mg/kg/day)
C: concentration of risk agent, mg/m3 for air medium, mg/l for drinking water, mg/kg for food or food
R: rate (rate) of intake (m3/day)tE: time of exposure/work in a day (h/day)fE: frequency of annual exposure (days/years)
Dt: duration of exposure, years (real-time or protection, 30 years for residential default values)
Wb: weight (kg)
tavg: average time period, (Dt×365 days/year for non-carcinogens, 70 years×365 days/year for carcinogens).
ResultThe source of benzene in the control room comes from the waste pit which is an open oil pool, so that with the help of sunlight, evaporation will occur and produce a strong benzene smell that can be carried by wind.
The working hours of the control room workers consist of 3 shifts were 1-morning shift, 1-night shift, and 1-holiday shift which changes every 3 days continuously. 1 shift has 12h of working hours, holidays do not affect them because the machines and tools on-site must always be maintained for 24h because if there is any damage, they can be immediately resolved and do not interfere with oil production.
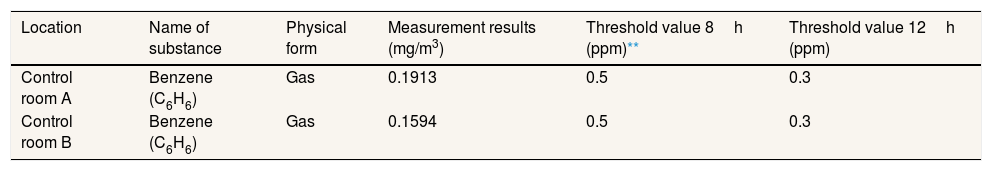
Concentration of benzene in the airSee Table 1.
Secondary data of benzene results in the air control room A and B in the 2018 Industrial Hygiene report.
| Location | Name of substance | Physical form | Measurement results (mg/m3) | Threshold value 8h (ppm)** | Threshold value 12h (ppm) |
|---|---|---|---|---|---|
| Control room A | Benzene (C6H6) | Gas | 0.1913 | 0.5 | 0.3 |
| Control room B | Benzene (C6H6) | Gas | 0.1594 | 0.5 | 0.3 |
* Data source: Work Environment Quality Monitoring Report (Industrial Hygiene) PT. X (Secondary Data).
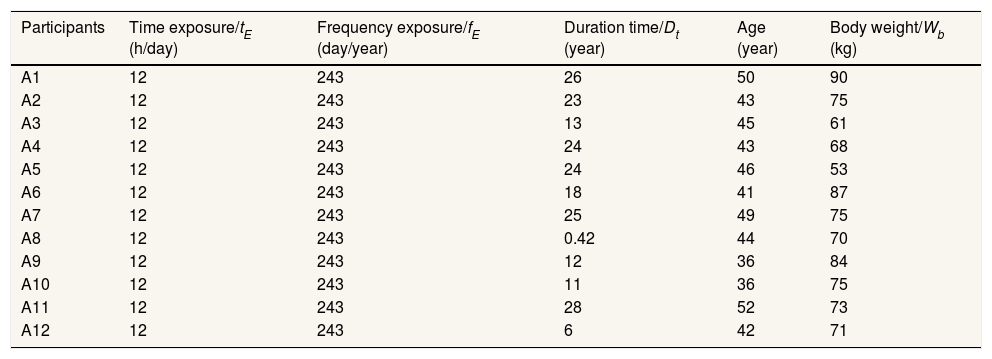
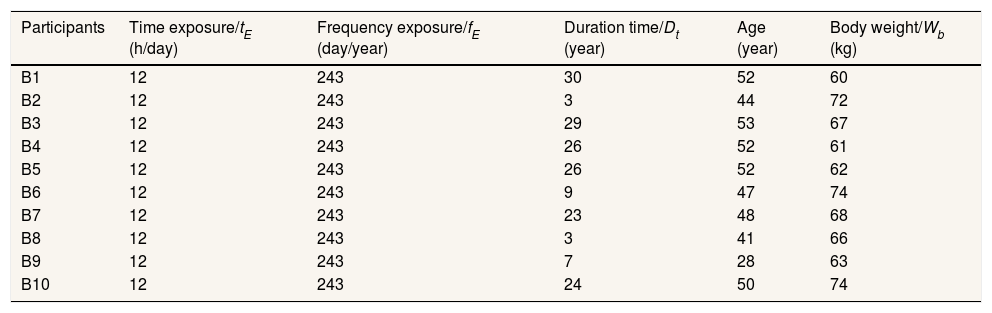
See Tables 2 and 3.
Distribution of benzene exposure pattern in air control room A.
| Participants | Time exposure/tE (h/day) | Frequency exposure/fE (day/year) | Duration time/Dt (year) | Age (year) | Body weight/Wb (kg) |
|---|---|---|---|---|---|
| A1 | 12 | 243 | 26 | 50 | 90 |
| A2 | 12 | 243 | 23 | 43 | 75 |
| A3 | 12 | 243 | 13 | 45 | 61 |
| A4 | 12 | 243 | 24 | 43 | 68 |
| A5 | 12 | 243 | 24 | 46 | 53 |
| A6 | 12 | 243 | 18 | 41 | 87 |
| A7 | 12 | 243 | 25 | 49 | 75 |
| A8 | 12 | 243 | 0.42 | 44 | 70 |
| A9 | 12 | 243 | 12 | 36 | 84 |
| A10 | 12 | 243 | 11 | 36 | 75 |
| A11 | 12 | 243 | 28 | 52 | 73 |
| A12 | 12 | 243 | 6 | 42 | 71 |
Distribution of benzene exposure pattern in air control room B.
| Participants | Time exposure/tE (h/day) | Frequency exposure/fE (day/year) | Duration time/Dt (year) | Age (year) | Body weight/Wb (kg) |
|---|---|---|---|---|---|
| B1 | 12 | 243 | 30 | 52 | 60 |
| B2 | 12 | 243 | 3 | 44 | 72 |
| B3 | 12 | 243 | 29 | 53 | 67 |
| B4 | 12 | 243 | 26 | 52 | 61 |
| B5 | 12 | 243 | 26 | 52 | 62 |
| B6 | 12 | 243 | 9 | 47 | 74 |
| B7 | 12 | 243 | 23 | 48 | 68 |
| B8 | 12 | 243 | 3 | 41 | 66 |
| B9 | 12 | 243 | 7 | 28 | 63 |
| B10 | 12 | 243 | 24 | 50 | 74 |
.
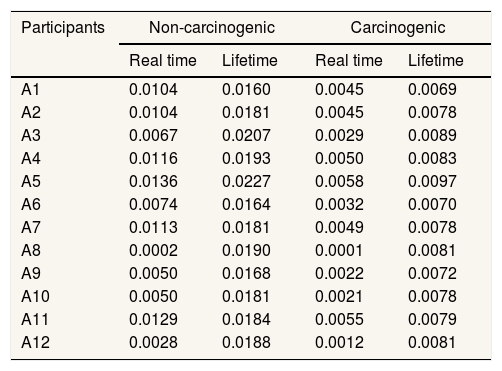
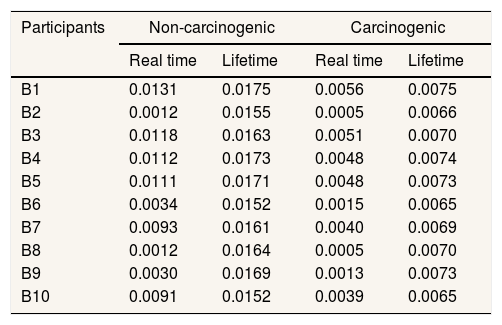
The calculation of the intake of non-cancer exposure is carried out to take into account the non-cancer effects that can occur on workers in 2 different times of exposure, namely real time and lifetime. In real time, real time figures are used, namely the length of time they have worked in that place, while the non-cancerous lifetime exposure is 40 years, which is obtained from workers starting to work until they retire (Tables 4 and 5).
The value of intake (intake) of non-carcinogenic and carcinogenic effects in control room A employees.
| Participants | Non-carcinogenic | Carcinogenic | ||
|---|---|---|---|---|
| Real time | Lifetime | Real time | Lifetime | |
| A1 | 0.0104 | 0.0160 | 0.0045 | 0.0069 |
| A2 | 0.0104 | 0.0181 | 0.0045 | 0.0078 |
| A3 | 0.0067 | 0.0207 | 0.0029 | 0.0089 |
| A4 | 0.0116 | 0.0193 | 0.0050 | 0.0083 |
| A5 | 0.0136 | 0.0227 | 0.0058 | 0.0097 |
| A6 | 0.0074 | 0.0164 | 0.0032 | 0.0070 |
| A7 | 0.0113 | 0.0181 | 0.0049 | 0.0078 |
| A8 | 0.0002 | 0.0190 | 0.0001 | 0.0081 |
| A9 | 0.0050 | 0.0168 | 0.0022 | 0.0072 |
| A10 | 0.0050 | 0.0181 | 0.0021 | 0.0078 |
| A11 | 0.0129 | 0.0184 | 0.0055 | 0.0079 |
| A12 | 0.0028 | 0.0188 | 0.0012 | 0.0081 |
The value of intake (intake) of non-carcinogenic and carcinogenic effects in control room B employees.
| Participants | Non-carcinogenic | Carcinogenic | ||
|---|---|---|---|---|
| Real time | Lifetime | Real time | Lifetime | |
| B1 | 0.0131 | 0.0175 | 0.0056 | 0.0075 |
| B2 | 0.0012 | 0.0155 | 0.0005 | 0.0066 |
| B3 | 0.0118 | 0.0163 | 0.0051 | 0.0070 |
| B4 | 0.0112 | 0.0173 | 0.0048 | 0.0074 |
| B5 | 0.0111 | 0.0171 | 0.0048 | 0.0073 |
| B6 | 0.0034 | 0.0152 | 0.0015 | 0.0065 |
| B7 | 0.0093 | 0.0161 | 0.0040 | 0.0069 |
| B8 | 0.0012 | 0.0164 | 0.0005 | 0.0070 |
| B9 | 0.0030 | 0.0169 | 0.0013 | 0.0073 |
| B10 | 0.0091 | 0.0152 | 0.0039 | 0.0065 |
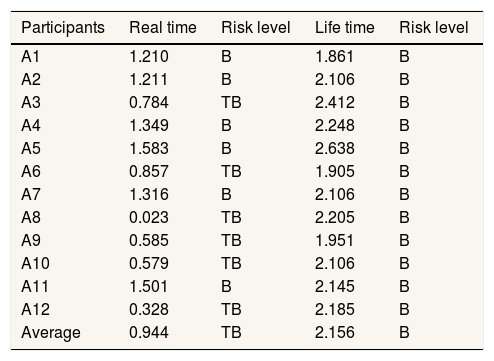
The risk characteristics are used to distinguish the health effects of non-cancer and cancer from the parameters tested, namely benzene. The risk characteristics for non-cancerous effects can be determined using the following formula:

After getting the RQ value, it can be assumed as follows:
- •
If RQ<1, then the hazard concentration is not at risk of causing non-carcinogenic health effects.
- •
If RQ>1, then the hazard concentration is already at risk of causing non-carcinogenic health effects.
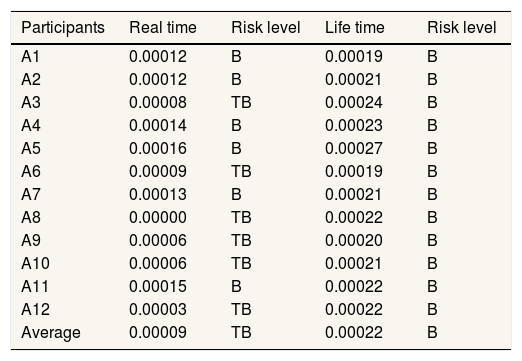
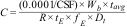
The characteristics for the cancer effect can be determined by multiplying the carcinogenic intake value by the CSF value (Tables 6–9).

Distribution of risk quotient (RQ) values in control room A.
| Participants | Real time | Risk level | Life time | Risk level |
|---|---|---|---|---|
| A1 | 1.210 | B | 1.861 | B |
| A2 | 1.211 | B | 2.106 | B |
| A3 | 0.784 | TB | 2.412 | B |
| A4 | 1.349 | B | 2.248 | B |
| A5 | 1.583 | B | 2.638 | B |
| A6 | 0.857 | TB | 1.905 | B |
| A7 | 1.316 | B | 2.106 | B |
| A8 | 0.023 | TB | 2.205 | B |
| A9 | 0.585 | TB | 1.951 | B |
| A10 | 0.579 | TB | 2.106 | B |
| A11 | 1.501 | B | 2.145 | B |
| A12 | 0.328 | TB | 2.185 | B |
| Average | 0.944 | TB | 2.156 | B |
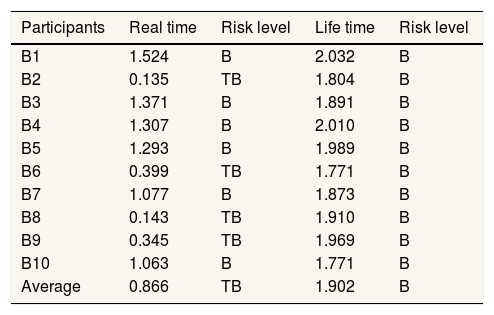
Distribution of risk quotient (RQ) values in control room B.
| Participants | Real time | Risk level | Life time | Risk level |
|---|---|---|---|---|
| B1 | 1.524 | B | 2.032 | B |
| B2 | 0.135 | TB | 1.804 | B |
| B3 | 1.371 | B | 1.891 | B |
| B4 | 1.307 | B | 2.010 | B |
| B5 | 1.293 | B | 1.989 | B |
| B6 | 0.399 | TB | 1.771 | B |
| B7 | 1.077 | B | 1.873 | B |
| B8 | 0.143 | TB | 1.910 | B |
| B9 | 0.345 | TB | 1.969 | B |
| B10 | 1.063 | B | 1.771 | B |
| Average | 0.866 | TB | 1.902 | B |
Distribution of excess cancer risk (ECR) values in control room A.
| Participants | Real time | Risk level | Life time | Risk level |
|---|---|---|---|---|
| A1 | 0.00012 | B | 0.00019 | B |
| A2 | 0.00012 | B | 0.00021 | B |
| A3 | 0.00008 | TB | 0.00024 | B |
| A4 | 0.00014 | B | 0.00023 | B |
| A5 | 0.00016 | B | 0.00027 | B |
| A6 | 0.00009 | TB | 0.00019 | B |
| A7 | 0.00013 | B | 0.00021 | B |
| A8 | 0.00000 | TB | 0.00022 | B |
| A9 | 0.00006 | TB | 0.00020 | B |
| A10 | 0.00006 | TB | 0.00021 | B |
| A11 | 0.00015 | B | 0.00022 | B |
| A12 | 0.00003 | TB | 0.00022 | B |
| Average | 0.00009 | TB | 0.00022 | B |
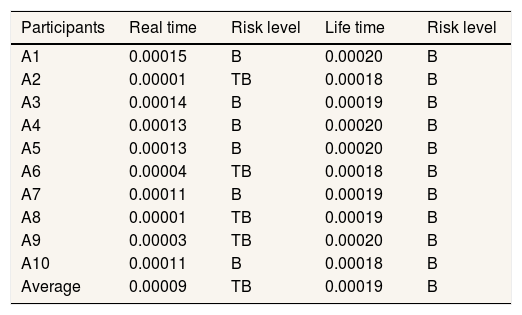
Distribution of excess cancer risk (ECR) values in control room B.
| Participants | Real time | Risk level | Life time | Risk level |
|---|---|---|---|---|
| A1 | 0.00015 | B | 0.00020 | B |
| A2 | 0.00001 | TB | 0.00018 | B |
| A3 | 0.00014 | B | 0.00019 | B |
| A4 | 0.00013 | B | 0.00020 | B |
| A5 | 0.00013 | B | 0.00020 | B |
| A6 | 0.00004 | TB | 0.00018 | B |
| A7 | 0.00011 | B | 0.00019 | B |
| A8 | 0.00001 | TB | 0.00019 | B |
| A9 | 0.00003 | TB | 0.00020 | B |
| A10 | 0.00011 | B | 0.00018 | B |
| Average | 0.00009 | TB | 0.00019 | B |
Notes: B: risk of carcinogenic health effects; TB: no risk of carcinogenic effects.
After getting the ECR value, the following assumptions are used:
- •
If the ECR <10-4, then the hazard concentration has not caused a carcinogenic health effect.
- •
If the ECR >10-4, then the hazard concentration values have already caused carcinogenic health effects.
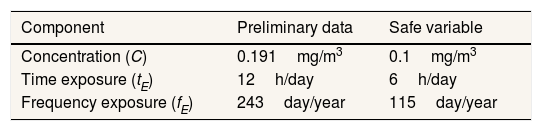
Risk management is an effort to protect the object of research, in this case, workers from the influence of benzene, which can cause non-carcinogenic and carcinogenic health effects. The first way to do after a risk analysis is to reduce the concentration of benzene exposure and reduce the contact time of workers with benzene (Table 10).8
Data from the calculation of risk control options for the effects of cancer on safe benzene exposure in the employee population of control room A and B.
| Component | Preliminary data | Safe variable |
|---|---|---|
| Concentration (C) | 0.191mg/m3 | 0.1mg/m3 |
| Time exposure (tE) | 12h/day | 6h/day |
| Frequency exposure (fE) | 243day/year | 115day/year |
Reduces concentration during life time exposure
Reduces the length of exposure (tE) during lifetime exposure
Reduces frequency of exposure (fE) during lifetime exposure
Discussion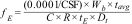
The results of individual calculations for the non-carcinogenic effect of benzene, the results obtained for control room A on real time exposure, 6 people who had an RQ value ≤1 and 6 people had an RQ value >1, at lifetime exposure there were no people who had an RQ value ≤1 would but there are 12 people who have an RQ value >1. In control room B on real time exposure, 4 people who have an RQ value ≤1 and 6 people have an RQ value >1, on lifetime exposure there are no people who have an RQ value ≤1 but there are 10 people who have an RQ value >1.
The results of individual calculations for the carcinogenic effect of benzene, the results obtained for control room A on real time exposure, 6 people had ECR values ≤10−4, and 6 people had ECR values >10−4, at lifetime exposure there were no people who had ECR values. ≤10−4 but 12 people who have ECR values >10−4. In control room B, on real time exposure, 4 people have an ECR value ≤10−4 and 6 people have an ECR value >10−4, at lifetime exposure there are no people who have an ECR value ≤10−4 but there are 10 people who have a value ECR >10−4.
The toxic effects of benzene exposure can be felt by the body in the short and long term. In the short term, benzene exposure will have an effect on throat problems and eye irritation. However, if the exposure is short term but the concentration is high enough the benzene exposure will cause narcosis: dizziness, headache, drowsiness, confusion, tremor, unconsciousness. In long-term exposure, the health effects due to benzene toxicity are on the bone marrow which is responsible for making blood cells so that it can cause leucopenia, anemia, and thrombocytopenia and prolonged exposure to benzene can cause leukemia.9
Provides more specific risk control guidelines for OHS hazards using approaches such as elimination, substitution, engineering control (technical approach), administrative control, and use of personal protective equipment (PPE). Since the benzene exposure in control rooms A and B came from a fixed source that could not be eliminated because it was used for the benefit of each company, the elimination and substitution approach could not be applied.10
The concentration of benzene exposure to control room A and B employees depends on the benzene content in crude oil (crude oil). Meanwhile, the time variable relates to the work rules/regulations that have been agreed upon between the employees and the management of control rooms A and B, which submit to labor regulations. The results of the calculation of risk management measures for concentration, duration, and frequency are for control room A and B 0.1mg/m3, 6h/day, 115days/year.
Therefore, risk control that can be done is by using engineering control (technical approach), administrative control (administrative control), and use of personal protective equipment (PPE). The first engineering control (technical approach) is to isolate the waste pit by adding a cover like a greenhouse with a gas channel and air suction so that the benzene content can be sucked up and disposed of in areas with less population.11
ConclusionThe risk control that can be done is to carry out administrative control by adding an existing shift that previously had 3 shifts to 4 or 8 shifts so that workers can work with the ON-OFF-ON system because by adding this shift it can reduce exposure time to 6h/day and exposure frequency to 122 days/year. The second is engineering control, it is recommended that PT X build a cover in each waste pit like a greenhouse so that the benzene content in the air does not pollute the environment, the use and supervision of PPE must be carried out to discipline workers to always use complete PPE while working to protect the health of workers.
Conflicts of interestThe authors declare no conflict of interest.
Peer-review under responsibility of the scientific committee of the 3rd International Nursing, Health Science Students & Health Care Professionals Conference. Full-text and the content of it is under responsibility of authors of the article.


