


The 3rd International Nursing and Health Sciences Students and Health Care Professionals Conference (INHSP)
More infoThis study aimed to compare serum levels of Growth Hormone in children with malnutrition and good nutritional status.
MethodThis cross-sectional study included 41 participants consisting of 31 malnourished, 10 well-nourished children aged between 36 and 60 months. Demographic data of participants were obtained utilizing a questionnaire. Nutritional status was determined by calculating the Z-score of body weight for age, height for age, and body weight for height indices using the WHO classification. GH levels were determined by the Enzyme-Linked Immunosorbent Assay (ELISA) method.
ResultMedian serum GH levels in malnourished children were found to be lower i.e. 1.25ng/mL (minimum–maximum: 0.10–6.19ng/mL) compared to well-nourished children 11.01ng/mL (1.72–15.64ng/mL).
ConclusionSerum GH levels can be used as indicators to assess nutritional status.
The World Health Organization (WHO) estimates that 159 million children experience stunted growth, and nearly 20 million children under 5years of age or toddlers suffer from acute severe malnutrition.1 Child who suffers from malnutrition are at risk 5–20 times greater than children with good nutrition2 and are responsible for 60% of toddlers’ deaths.3
Children aged 3–5 years have the risk of experiencing malnutrition. Nutrition problems often occur because children have started to become active consumers who tend to be picky about the food they want to consume.4 For toddlers who consume breast milk, the age most vulnerable to malnutrition is the age of two years because, during that time, the transition period from breast milk to breast milk substitutes or weaning food took place. Breastmilk substitutes and weaning foods often have a high carbohydrate content but shallow quality and protein content.5
In addition to causing death, malnutrition also interferes with the growth and development of intelligence, where those who experience malnutrition are reported to have a risk of losing their IQ by 10–13 points.6
Malnutrition is caused by a lack of protein, calories, or total energy. In toddlers, malnutrition is characterized by resistance to Growth Hormone (GH). Growth Hormone (GH) is the primary hormone that plays a role in growth in humans.7 Deficiency of nutrients or malnutrition will interfere with growth hormones such as lack of protein, zinc, vitamins so that it will result in low Insulin-like Growth Factor I (IGF-1) and Growth Hormone (GH).
The growth hormone that is also predicted to be the benchmark for determining nutritional status is the IGF-1 hormone with the binding protein IGFBP-3 and Leptin Hormone.8 Malnutrition needs to be detected early by identifying the growth and development of children under five because it is an ongoing problem and threatens the nation's future.9
The toddler period is the golden age that determines the future life. Nevertheless, unfortunately, identification of the nutritional status of toddlers by examining growth hormone levels is still rarely used. Lacks of socialization, knowledge, and studies that develop hormone tests in toddlers are why the examination of hormone levels in toddlers is rarely used. In comparison, the growth hormone examination is an accurate examination to determine the nutritional status of toddlers.
Research conducted by Fazeli and Klibanski entitled Determinants of Growth Hormone (GH) Resistance in Malnutrition concluded that GH levels play a role in malnutrition, and research in Ankara, Turkey showed that high levels of GH in the blood and low levels of IGF-1 in malnourished toddlers could be caused by a lack of energy intake, which causes GH resistance.10
MethodThis study used a cross-sectional study method, which is a design by measuring or observing at the same time using the Mann–Whitney statistical test. This study aimed to determine the levels of GH in malnourished children aged 36–60 months. This research was conducted at Puskesmas Bara-Baraya Makassar with a total sample of 41 people, consisting of 10 normal children and 31 malnourished children.
The instrument used in this study were questionnaires and measurements of GH levels. The questionnaire is data collection by providing a list of questions to the respondent, hoping that the respondent answers all these questions. Measurement of GH (Growth Hormone) levels was conducted by using ELISA (Enzyme-Linked Immunosorbent Assay) at the Hasanuddin University RSP Research Laboratory Unit.
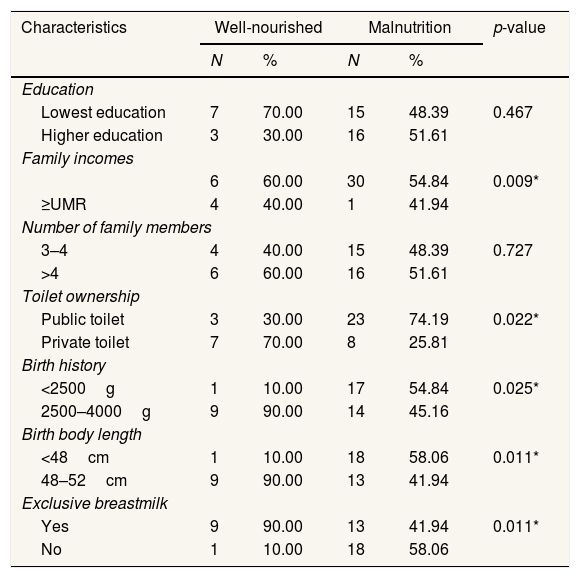
ResultsThe characteristics of the research respondents included education level, family income, number of family members, sanitation, birth weight, birth length, and history of exclusive breastfeeding. Contained in the table as follows.
The table above shows the number of maternal education is low; family income is at most
Distribution characteristics of respondents at Community Health Center (Puskesmas) Bara-Baraya Makassar (n=41).
| Characteristics | Well-nourished | Malnutrition | p-value | ||
|---|---|---|---|---|---|
| N | % | N | % | ||
| Education | |||||
| Lowest education | 7 | 70.00 | 15 | 48.39 | 0.467 |
| Higher education | 3 | 30.00 | 16 | 51.61 | |
| Family incomes | |||||
| 6 | 60.00 | 30 | 54.84 | 0.009* | |
| ≥UMR | 4 | 40.00 | 1 | 41.94 | |
| Number of family members | |||||
| 3–4 | 4 | 40.00 | 15 | 48.39 | 0.727 |
| >4 | 6 | 60.00 | 16 | 51.61 | |
| Toilet ownership | |||||
| Public toilet | 3 | 30.00 | 23 | 74.19 | 0.022* |
| Private toilet | 7 | 70.00 | 8 | 25.81 | |
| Birth history | |||||
| <2500g | 1 | 10.00 | 17 | 54.84 | 0.025* |
| 2500–4000g | 9 | 90.00 | 14 | 45.16 | |
| Birth body length | |||||
| <48cm | 1 | 10.00 | 18 | 58.06 | 0.011* |
| 48–52cm | 9 | 90.00 | 13 | 41.94 | |
| Exclusive breastmilk | |||||
| Yes | 9 | 90.00 | 13 | 41.94 | 0.011* |
| No | 1 | 10.00 | 18 | 58.06 | |
Fisher exact, p=sig <0.05.
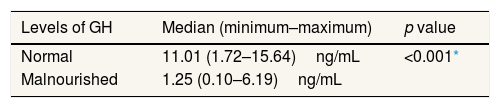
The Mann–Whitney statistical test was used to determine the differences in GH levels in malnourished and normal children because the GH level data were not normally distributed. The results of statistical tests showed that there were differences in GH levels in malnourished and normal children (p<0.001). Thus, the analysis indicates that the levels of Growth Hormone (GH) of malnourished children are low (Table 2).
Differences in levels of GH in malnourished and normal toddlers.
| Levels of GH | Median (minimum–maximum) | p value |
|---|---|---|
| Normal | 11.01 (1.72–15.64)ng/mL | <0.001* |
| Malnourished | 1.25 (0.10–6.19)ng/mL |
The Mann-Whitney test results showed a comparison of the levels of Growth Hormone (GH) between toddlers with normal nutritional status and toddlers with malnourished nutritional status. Based on the median value, the levels of growth hormone (GH) in malnourished toddlers were obtained from 6.19ng/mL to 0.10ng/mL, while in toddlers with normal nutritional status, the levels of growth hormone were obtained with very high variations starting from 15.64ng/mL to 1.72ng/mL.
When compared between toddlers with normal nutritional status and toddlers with malnourished nutritional status, the lowest growth hormone levels (1.25ng/mL) were found in toddlers with malnourished nutritional status, while the highest levels were found in toddlers with normal nutritional status (11.01ng/mL). Low levels of Growth Hormone (GH) in malnourished toddlers can be caused by a lack of protein, calories, or total energy, causing resistance to growth hormone or Growth Hormone (GH).8
Toddlers with normal growth hormone (GH) levels have better family socioeconomic, environmental, cultural, and educational levels as a source of nutrition than malnourished children. Low growth hormone (GH) levels in malnourished toddlers are indirectly influenced by either too little or unbalanced food intake and substitutes for breast milk or weaning foods. Breastmilk substitutes often have a high carbohydrate content but poor quality and protein content.5 Poor economic status causes the inability of the family to provide adequate nutrition and a home environment that meets health requirements.11 Poor housing conditions, such as inadequate physical housing conditions and high occupancy density, predisposes factors that make children more susceptible to various infectious diseases, which could be the main cause of malnutrition.12
Deficiency of nutrients or malnutrition will interfere with growth hormones such as lack of protein, zinc, vitamins resulting in low Insulin-like Growth Factor I (IGF-1) and Growth Hormone (GH). Low concentrations of these hormones can inhibit linear growth until weight growth stops. The growth spurt in infancy causes rapid tissue synthesis, which results in low serum and plasma zinc. In addition, zinc plays a role in bone formation and mineralization so that in the case of zinc deficiency, GH metabolism is inhibited, which results in reduced IGF-1 synthesis and secretion.13
Insulin-Like Growth Factor-1 (IGF-1), along with GH, is a hormone produced by the liver and other tissues in response to the stimulation of GH, which functions to influence the growth and development of bones and skeletal muscles.14
Growth hormone binds to the extracellular domain and results in the activation of several intracellular signaling pathways. When malnutrition occurs, Leptin, responsible for sending signals, is disrupted, causing GH (Growth Hormone) receptors to be reduced in calorie restriction, resulting in underweight problems.15
The function of IGF-1 is to metabolize food protein, energy, and carbohydrates16 as well as cartilage growth. Therefore, when the amount of Insulin-Like Growth Factor-1 (IGF-1) secreted increases in response to Growth Hormone (GH) stimulation, there will be an increase in Insulin-Like Growth Factor Binding Protein-3 (IGFBP-3) to absorb it in the circulation. The low concentration of IGFBP-3 can inhibit linear growth and stop growth in body weight and height.17
In a study conducted by Fazeli and Klibanski, it was concluded that GH levels play a role in malnutrition. Without enough GH, a child tends to grow more slowly than other children of the same age and gender.
ConclusionA cross-sectional study has been conducted, and after statistical analysis, it can be concluded that there are differences in the levels of Growth Hormone (GH) in the nutritional status of toddlers where normal toddlers have high growth hormone levels ranging from 15.64ng/mL to 1.72ng/mL. On the other hand, malnourished toddlers have low growth hormone levels ranging from 6.19ng/mL to 0.10ng/mL. Thus it can be concluded that the GH value in malnourished toddlers is low.
Conflicts of interestThe authors declare no conflict of interest.
Peer-review under responsibility of the scientific committee of the 3rd International Nursing, Health Science Students & Health Care Professionals Conference. Full-text and the content of it is under responsibility of authors of the article.


