


There is a renewed interest in health system indicators. In 1976 a measure of quality of healthcare, amenable mortality, was introduced by Rutstein. This indicator is based on the concept that deaths from certain causes should not occur in the presence of timely and effective healthcare. In the project “Amenable mortality in the European Union: toward better indicators for the effectiveness of health systems” (AMIEHS), we introduce a new approach to the selection of indicators of amenable mortality.
MethodsBased on predefined selection criteria and a broad review of the literature on the effectiveness of medical interventions, a first set of potential indicators of amenable mortality (causes of death) was selected. The timing of the introduction of medical innovations was established through reviews and questionnaires sent to national experts from seven participating European countries. The preselected indicators were then validated by a trend analysis that identified associations between the timing of innovations and cause-specific mortality trends and by a Delphi-procedure.
ResultsAfter a short review of previous lists of amenable mortality indicators and a detailed description of the innovative procedure in the AMIEHS project we present a list of 14 causes of death that passed our selection criteria. We illustrate our empirical validation of these indicators using the examples of peptic ulcer and renal failure.
ConclusionsThe innovation developed in the AMIEHS study is a rigorous new approach to the concept of amenable mortality that includes empirical validation. Only validated indicators can be successfully used to assess the quality of healthcare systems in international comparisons.
Actualmente hay un renovado interés por los indicadores para los sistemas de salud. En 1976, Rutstein propuso la «mortalidad tratable» como una medida de la calidad de la atención en salud, partiendo de que ciertas causas de muerte no deben presentarse si se cuenta con atención médica oportuna y eficaz. Un nuevo enfoque se presenta en el proyecto «Mortalidad tratable en la Unión Europea: en procura de mejores indicadores para los sistemas de salud» (AMIEHS, por sus siglas en inglés) para seleccionar indicadores de mortalidad tratable.
MétodosBasándose en criterios predefinidos y en una extensa revisión de la literatura sobre la efectividad de las intervenciones médicas, se seleccionó un primer conjunto de indicadores potenciales de mortalidad tratable (causas de muerte). El momento de la introducción de las innovaciones médicas se fijó mediante revisiones y cuestionarios enviados a expertos de siete países europeos participantes. Se validaron los indicadores preseleccionados identificando la asociación entre la introducción de las innovaciones y el análisis de tendencias para causas de muerte específicas y usando un Delphi.
ResultadosTras revisar anteriores listas de indicadores de mortalidad tratable y describir el procedimiento innovador en el proyecto AMIEHS, presentamos una lista de 14 causas de muerte que cumplen los criterios de selección. Luego ilustramos nuestra validación empírica usando como ejemplos la úlcera péptica y la insuficiencia renal.
ConclusionesLa innovación del estudio AMIEHS es una aproximación rigurosa a la nueva concepción de la mortalidad tratable que incluye validación empírica. Para evaluar la calidad de los sistemas de salud en comparación con otros países sólo pueden usarse con éxito indicadores validados.
The introduction of new pharmaceuticals and treatment methods during the late 20th century, and new and more effective ways of organizing care, mean that health care now contributes demonstrably to improved population health.1,2 However, as national health spending has tended to outstrip economic growth in most OECD countries in recent years, reaching 9% of GDP on average,3 it is important to quantify what this additional spending has achieved. The World Health Report 2000 identified health gain as a fundamental goal of health systems4 but was unable to assess the specific contribution of health care. It also stimulated an increasing interest in performance of health systems with improved tools being sought avidly by policy-makers seeking to determine whether they are getting value for money in health care systems.
In the early 1970s Rutstein introduced the concept of mortality amenable to medical care. His working group selected over 90 conditions as “sentinel health events” from which disease, disability or death “should not occur in the presence of timely and effective care”.5 In 1977 and 1980, revisions of this list were undertaken.6,7 They have formed the basis for practically all subsequent studies on amenable mortality. Charlton was the first to apply the concept at the population level in England and Wales in 1974-78, also introducing the terms “avoidable deaths” and “conditions amenable to medical intervention”.8 He narrowed the concept by excluding deaths that were not directly linked to medical care, e.g. deaths avoided by policies on tobacco control. The concept was developed further within the Health Services Research Program of the European Community in the 1980s. This collaborative action resulted in a European Community atlas of avoidable mortality in which the work of Charlton and colleagues was extended and the boundaries of health services were interpreted as encompassing primary care, hospital care and collective health services.9 In 2001 Tobias and Jackson produced an updated list of conditions derived from an expert consensus exercise in which the relative avoidability of death was distributed according to primary, secondary and tertiary actions.10
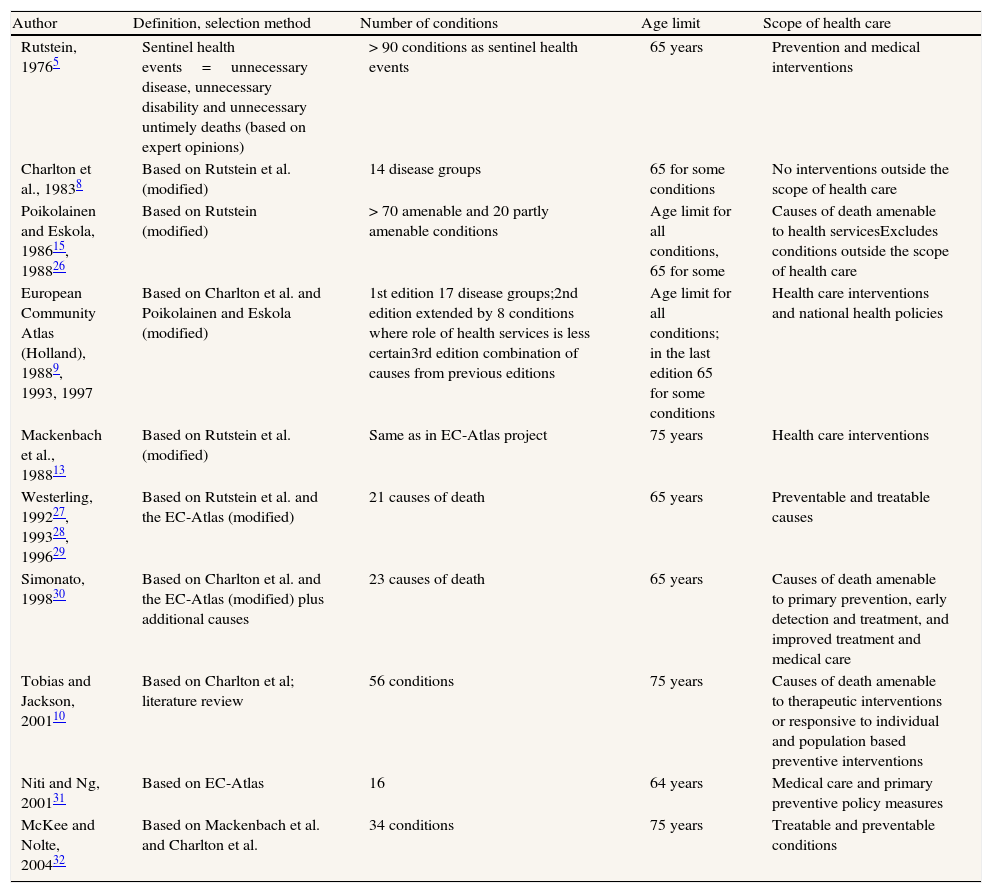
Although the concept underpinning amenable mortality has been widely accepted since its first introduction by Rutstein, it has also been criticized,11,12 mostly on the basis that the relation between health care interventions and amenable mortality has not been tested empirically. Critics argue that for amenable mortality to be established as a valid indicator of the outcome of health care, direct analyses of its effect on mortality are needed. This has been addressed in the existing literature by two means; first, in time series analyses, based on the implicit assumption that innovations in health care affect the trend in mortality and, second, geographically, by comparing mortality in regions with different levels of health care. Time series analyses show faster decline in mortality in recent decades from most of the conditions identified as amenable compared to non-amenable.13–15 This has been used to support the argument that at least part of the overall mortality decline is due to improvements in health care. Two studies of geographical variation also found mortality differences for amenable conditions correlated with availability of corresponding health care interventions among countries16 and regions.8Table 1 presents a summary of the progressive refinement of conditions amenable to health care.
Overview of studies with distinct lists of indicators of amenable mortality.
| Author | Definition, selection method | Number of conditions | Age limit | Scope of health care |
| Rutstein, 19765 | Sentinel health events=unnecessary disease, unnecessary disability and unnecessary untimely deaths (based on expert opinions) | > 90 conditions as sentinel health events | 65 years | Prevention and medical interventions |
| Charlton et al., 19838 | Based on Rutstein et al. (modified) | 14 disease groups | 65 for some conditions | No interventions outside the scope of health care |
| Poikolainen and Eskola, 198615, 198826 | Based on Rutstein (modified) | > 70 amenable and 20 partly amenable conditions | Age limit for all conditions, 65 for some | Causes of death amenable to health servicesExcludes conditions outside the scope of health care |
| European Community Atlas (Holland), 19889, 1993, 1997 | Based on Charlton et al. and Poikolainen and Eskola (modified) | 1st edition 17 disease groups;2nd edition extended by 8 conditions where role of health services is less certain3rd edition combination of causes from previous editions | Age limit for all conditions; in the last edition 65 for some conditions | Health care interventions and national health policies |
| Mackenbach et al., 198813 | Based on Rutstein et al. (modified) | Same as in EC-Atlas project | 75 years | Health care interventions |
| Westerling, 199227, 199328, 199629 | Based on Rutstein et al. and the EC-Atlas (modified) | 21 causes of death | 65 years | Preventable and treatable causes |
| Simonato, 199830 | Based on Charlton et al. and the EC-Atlas (modified) plus additional causes | 23 causes of death | 65 years | Causes of death amenable to primary prevention, early detection and treatment, and improved treatment and medical care |
| Tobias and Jackson, 200110 | Based on Charlton et al; literature review | 56 conditions | 75 years | Causes of death amenable to therapeutic interventions or responsive to individual and population based preventive interventions |
| Niti and Ng, 200131 | Based on EC-Atlas | 16 | 64 years | Medical care and primary preventive policy measures |
| McKee and Nolte, 200432 | Based on Mackenbach et al. and Charlton et al. | 34 conditions | 75 years | Treatable and preventable conditions |
Previous research applying amenable mortality to health system comparisons have differed in their choice of indicators (e.g. Rutstein, Charlton or Holland, sometimes with adaptations). They have also varied in how they define “health care”. Finally, different upper age limits are used to define which deaths are considered amenable, which is justified because medical conditions may be amenable up to different ages, but which may also introduce a bias if different studies use different age limits. It has been noted that the lack of explicit criteria for selecting indicators of amenable mortality is an important shortcoming of the existing literature.12,14 The knowledge on indicators of amenable mortality is insufficient to believe that amenable mortality can serve as an indicator for the quality of health care because hardly any validation is done to reveal an empirical relation between the quality of health care and mortality outcome.
In the following method section we describe a systematic approach to select indicators of amenable mortality including an explicit list of initial selection criteria. We define health care as primary care, hospital care and personalized public health services (e.g. immunization and screening). The result section shows 14 causes of death that fulfilled the initial criteria, gives two examples how these causes of death were tested in an empirical validation analysis and presents the results of a Delphi procedure.
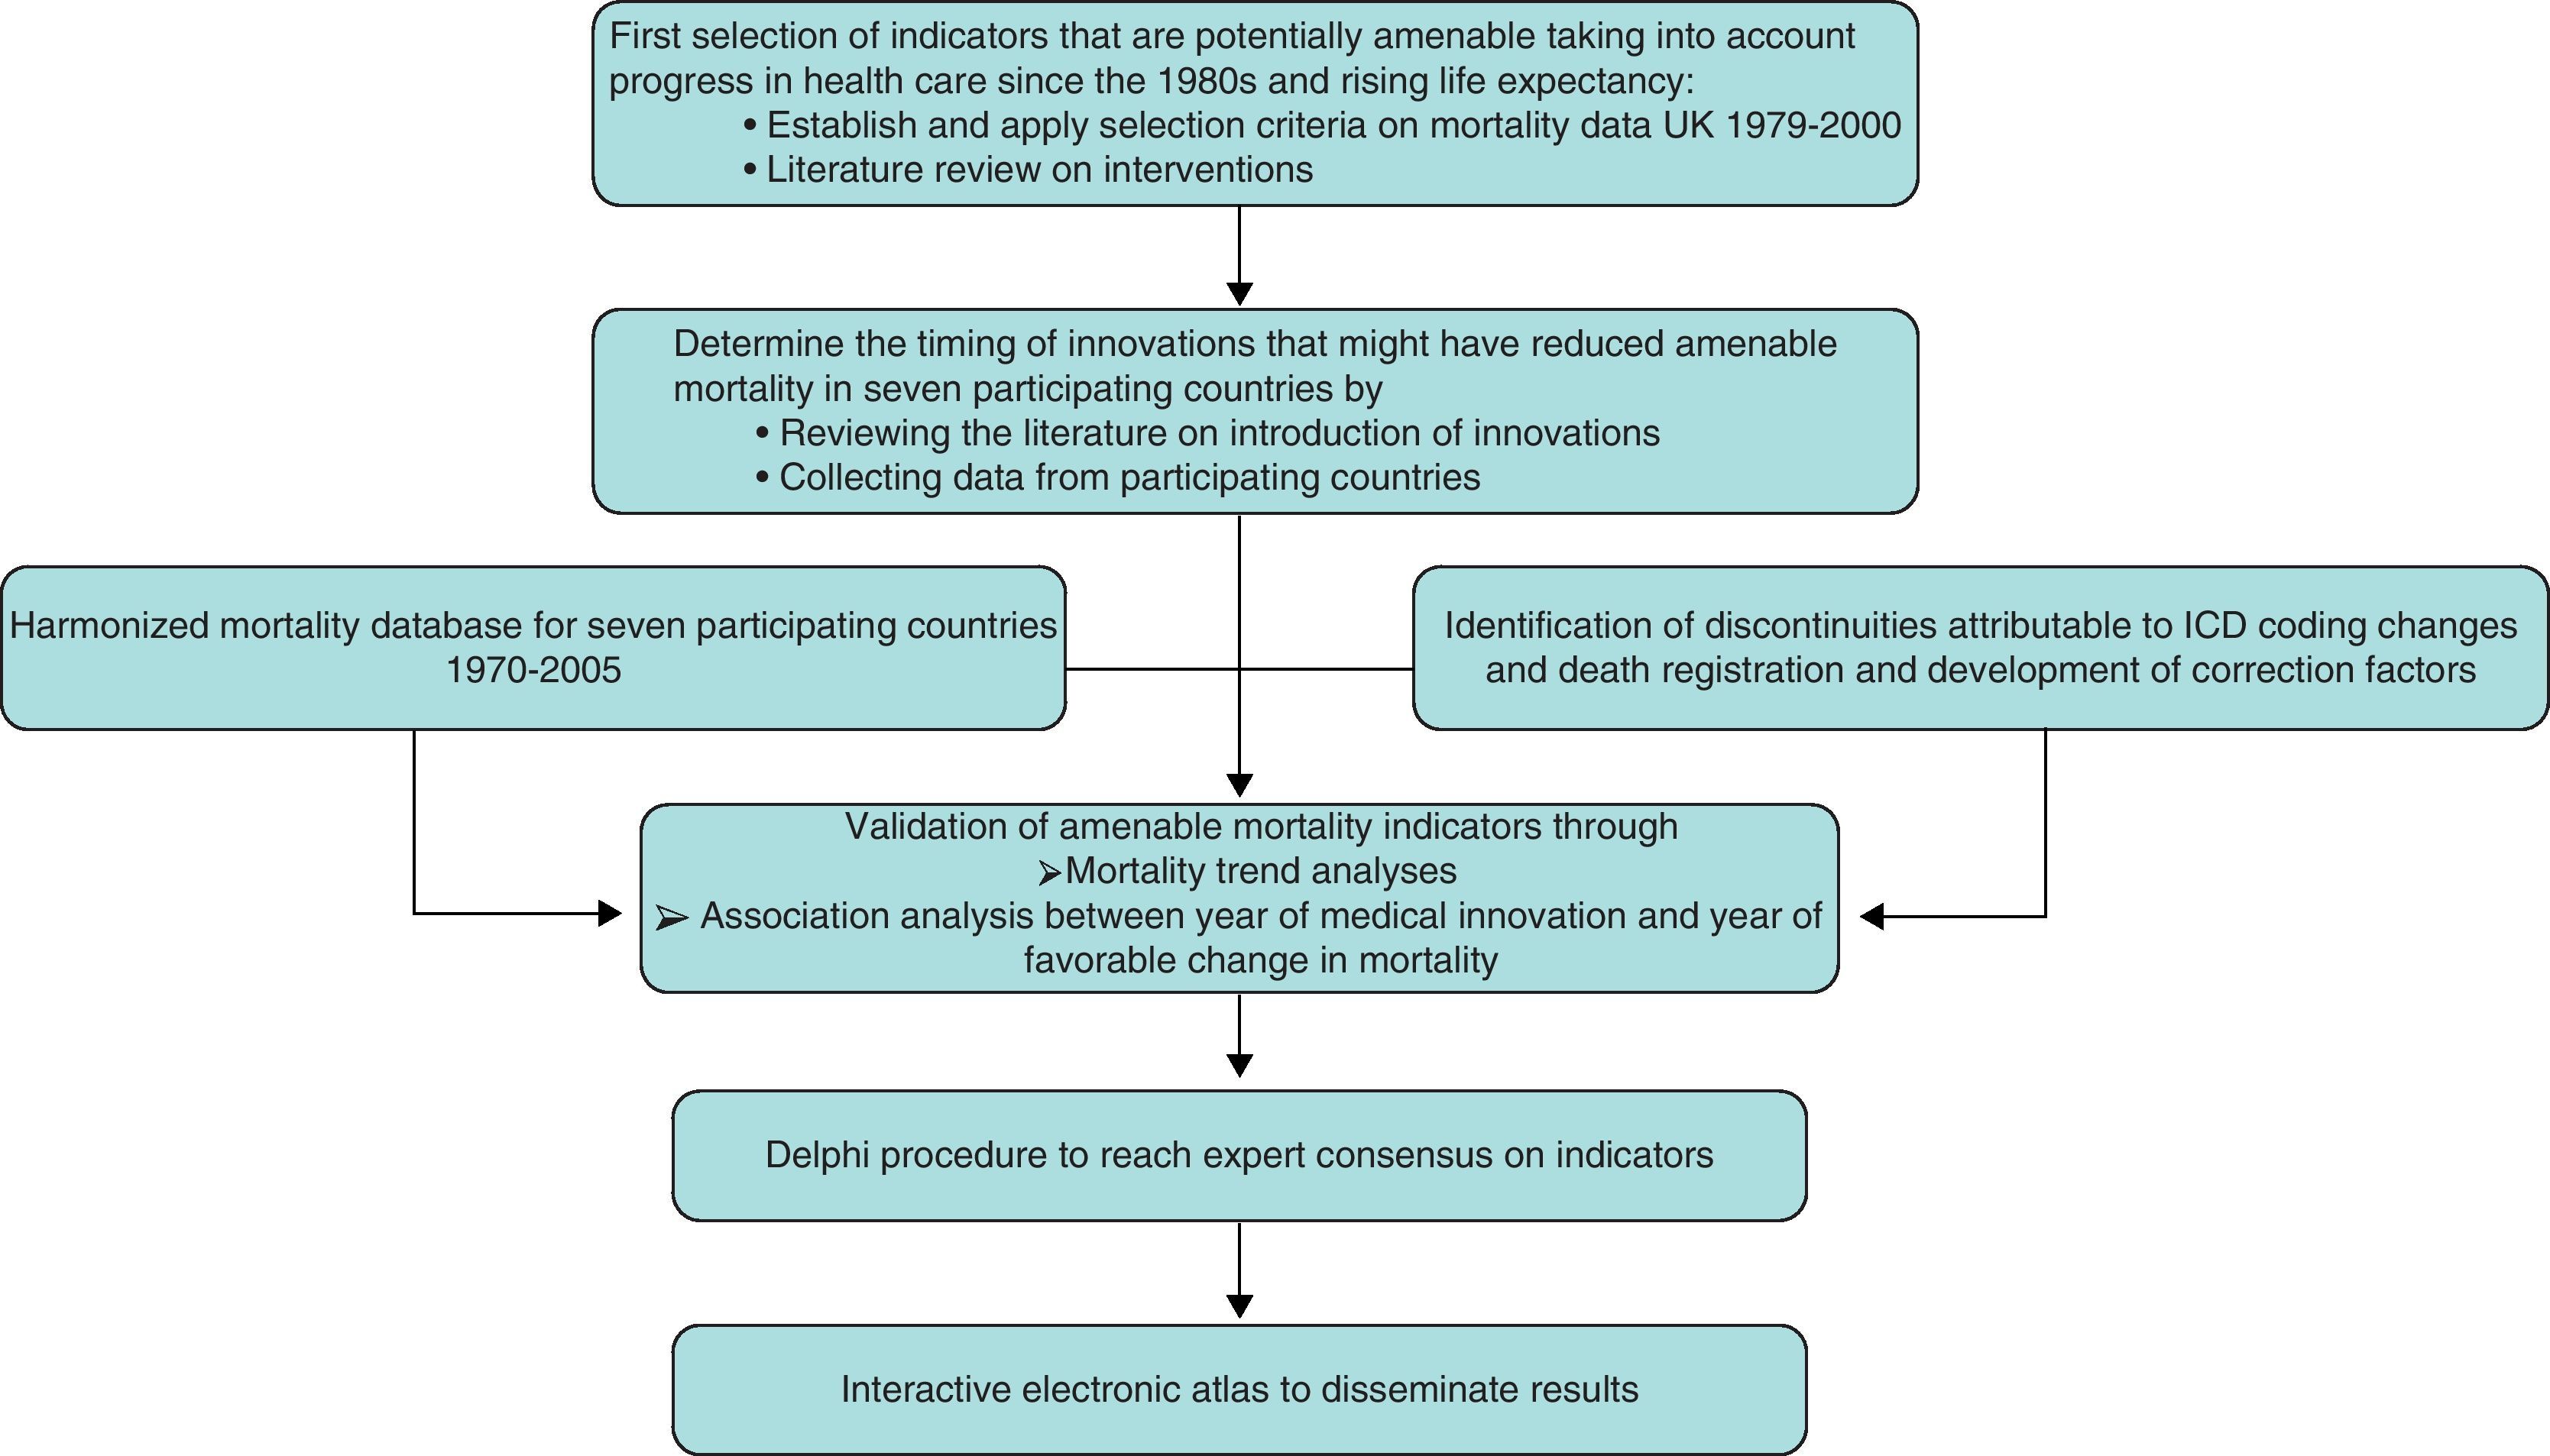
MethodsThe AMIEHS project (Amenable Mortality in the European Union: towards better Indicators for the Effectiveness of Health Systems; http://amiehs.lshtm.ac.uk) has six aims, corresponding to the six levels in the project structure in Figure 1. The outcome, a list of indicators of amenable mortality, should provide insights into quality of health care.
Criteria for the preliminary selection of causes of death
- 1.
A substantial decline in mortality in a country with a well-developed health system.
- 2.
The cause of a sufficient number of deaths so that rates are likely to be stable over time.
- 3.
The existence of a distinct clinical innovation of proven effectiveness introduced in recent years.
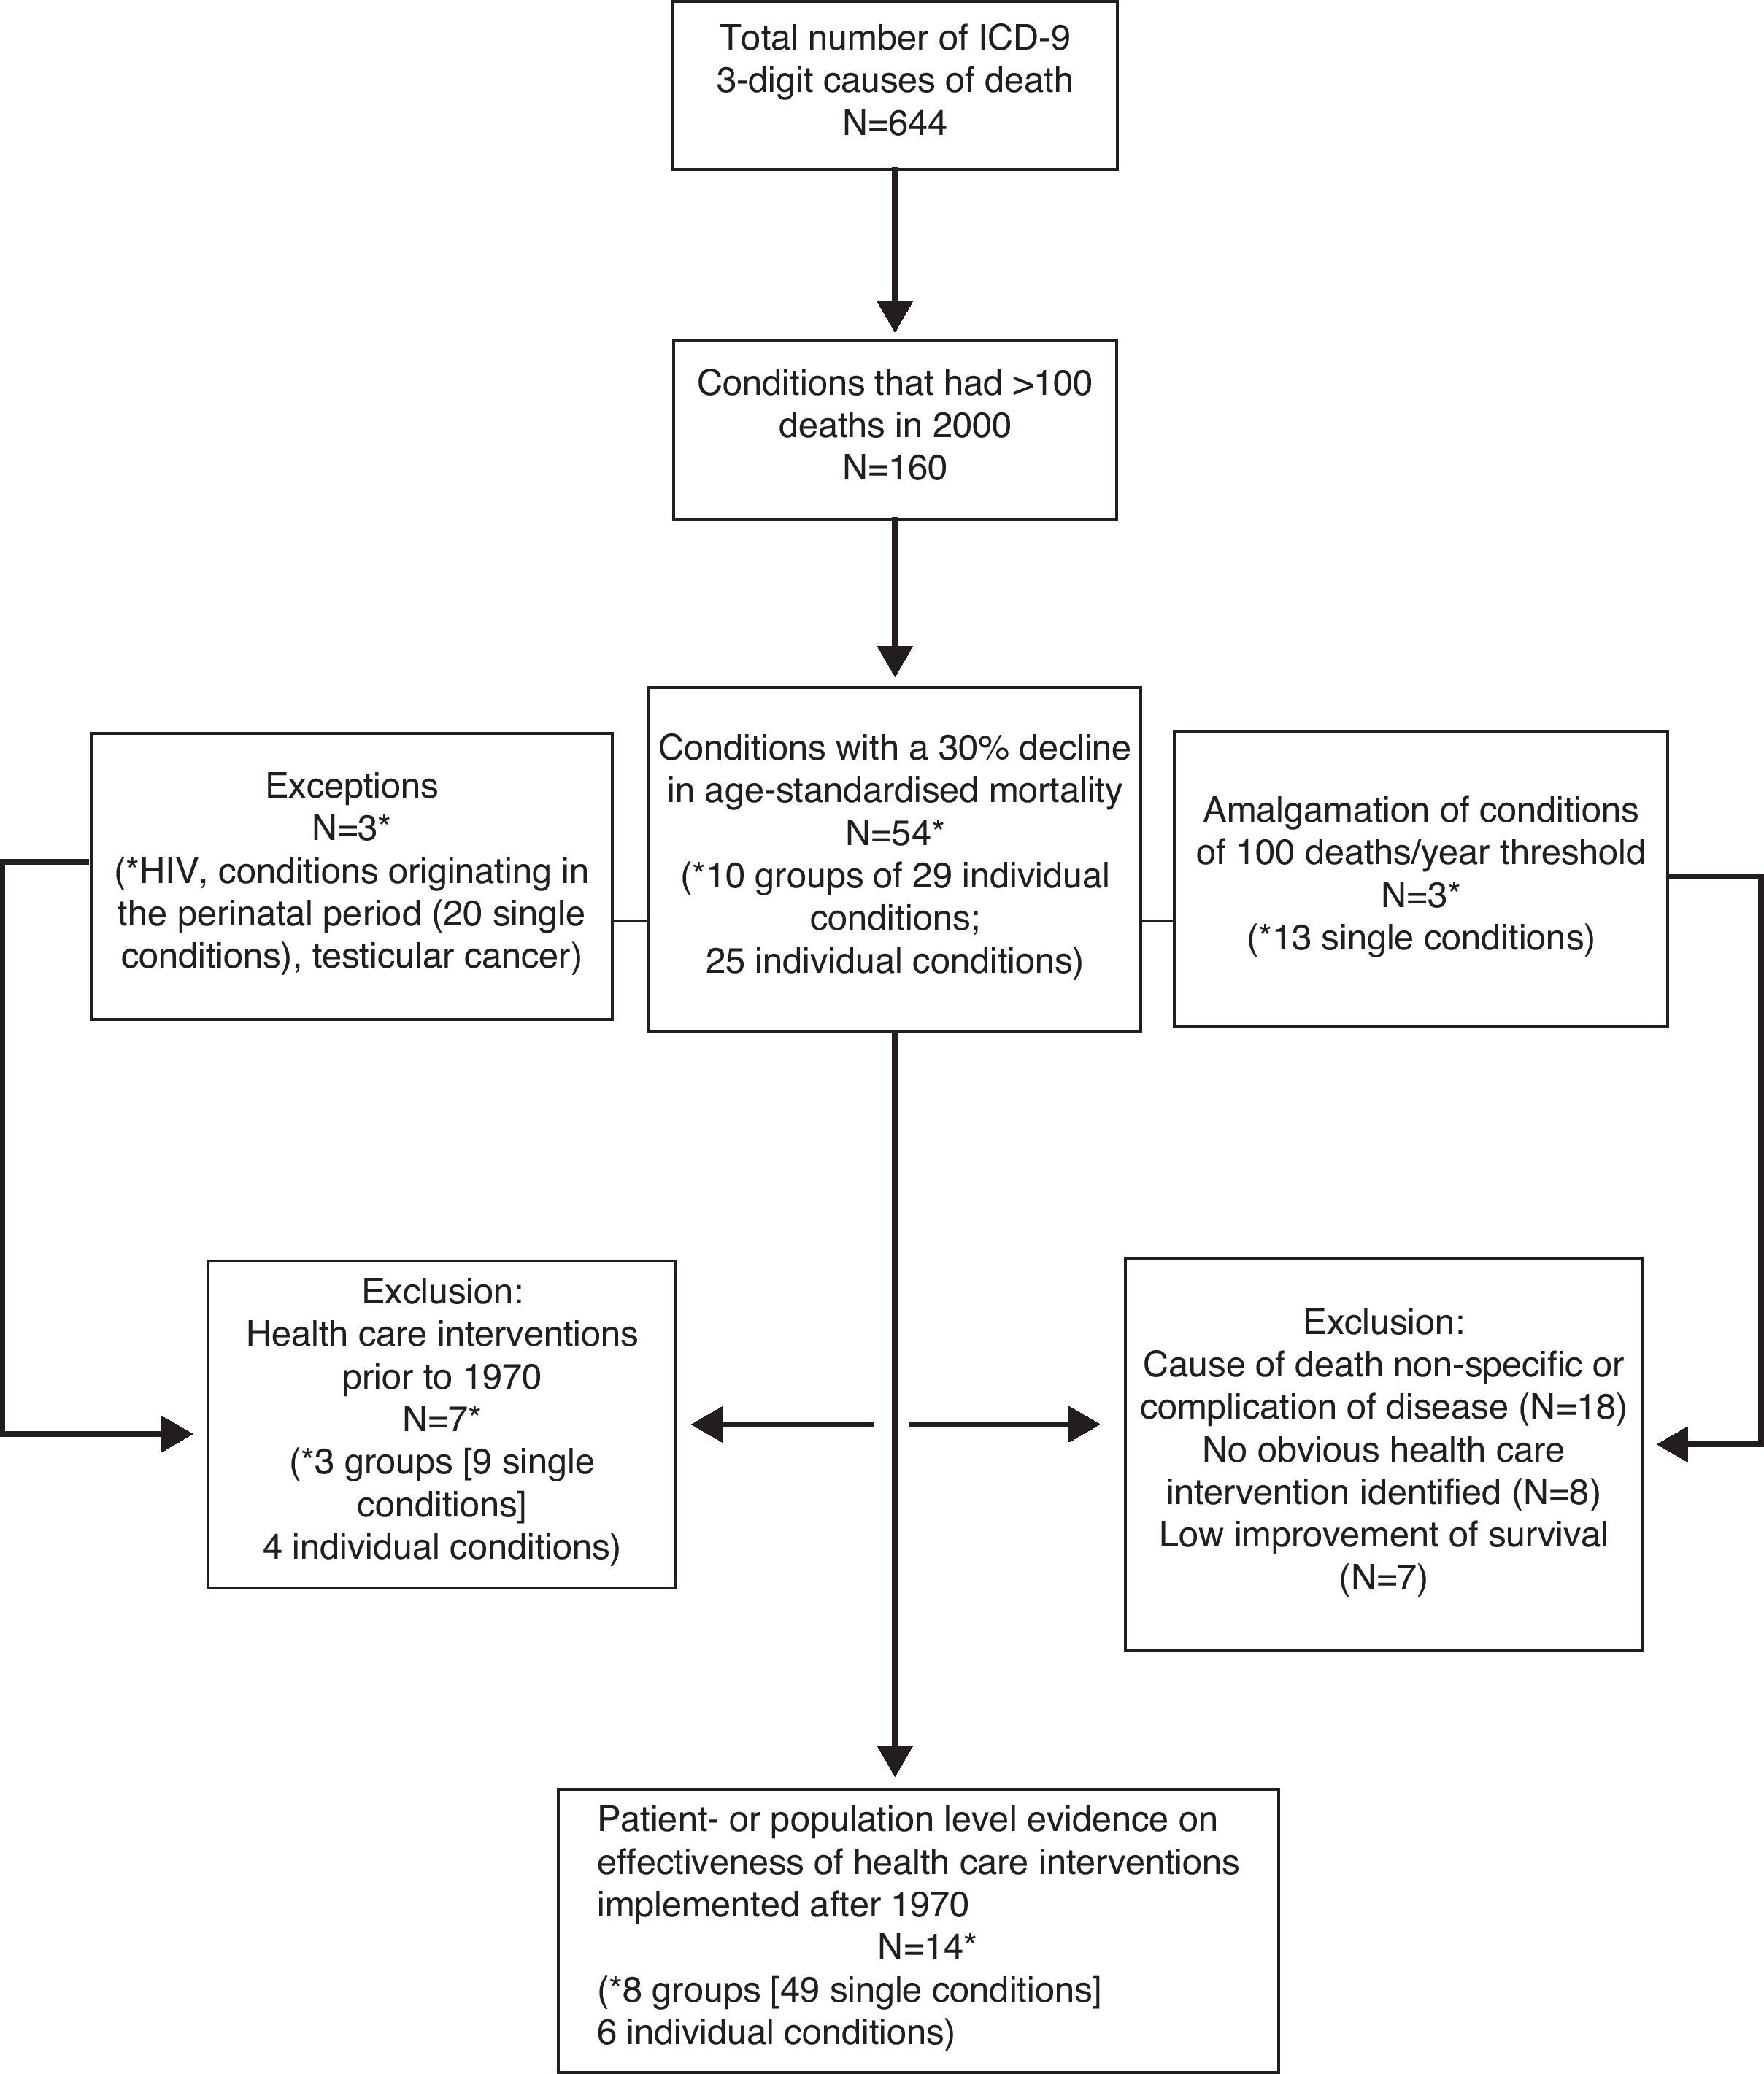
Selection of the standards that must be achieved according to each of these criteria is inevitably arbitrary. Our choice of the magnitude of decline was 30%. We recognized that, among those conditions causing an appreciable number of deaths, even the best health care system could not prevent all deaths even if a highly effective treatment exists, so the figure should be less than 100%. Similarly, if the death rate has fallen by only a small amount in the presence of a generally well-performing health system, it is unlikely that health care is currently contributing, or has the potential to contribute much to the decline. For practical reasons a single country was used to check this criteria that should be of sufficient size to reduce the risk of spurious results arising from small numbers, be one where a continuous set of mortality data were available spanning over two decades, and be one where any changes in coding or other data artefacts were already known. We ultimately chose England and Wales. We must then specify the time period over which to measure any decline. Given the need to avoid problems from coding changes, we selected the period in which ICD-9 was in use (1979-2000). The choice of threshold for numbers of deaths takes account of the fact that, for many EU member states, the deaths would be likely to be substantially fewer than in England and Wales. After discussion, a threshold of 100 has been selected.
These criteria and standards were applied to each 3-digit ICD-9 code in 1979 and 1990 in England and Wales. Some adjustments are needed to take account of coding changes. One is a change in how perinatal deaths were coded; another is to include AIDS which was not in the initial version of ICD-9 but which, it was agreed from inspection of other data, would otherwise meet the criteria. Another modification was to group together the various forms of groin hernia, each having a separate code and falling below the threshold of 100 deaths, but clearly treated in a similar way.
Those conditions meeting the criteria were then inspected to determine inclusion in the next step. We excluded those that are: a) non-specific codes, such as “other disorders of the…”, and b) conditions for which, on the basis of clinical knowledge, no specific intervention can be identified. For the rest, a series of systematic literature reviews was undertaken. It sought two types of evidence. First, evidence from well conducted observational studies (typically of populations or patients attending a facility or service) documenting a decline in mortality that could, with some confidence, be attributed to the intervention). Second were randomized controlled trials, again showing a decline in mortality of 30% or more. The evidence was graded on a four point scale: 4, evidence from systematic reviews or meta-analysis; 3, evidence from one or more randomized controlled trial; 2, evidence from observational studies; 1, consensus statements or expert opinions. We excluded innovations implemented before 1970 as being of little contemporary relevance in high-income countries.
Data collection on the timing of introduction of health care interventions related to pre-selected causes of deathCountry specific information was obtained on the year of introduction and the process of diffusion within a country for each intervention. A questionnaire was developed and distributed in which representatives of the participating countries were asked to identify sources of information about the introduction of these interventions. This was answered by reference to a wide range of data sources such as national guidelines, committee reports, scientific papers, data on registration and sales of pharmaceuticals. By combining the data within a theoretical framework of “diffusion of innovation”17 further developed by Rogers,18,19 we determined when we would expect a favorable change in mortality at a population level in each country.
Validation of possible indicators of amenable mortality by mortality trend analysisIn order to relate the timing of innovations to changes in mortality a harmonized database was constructed for the period from 1970 to 2005 using mortality data from Estonia, France, Germany (East and West separately), The Netherlands, Spain, Sweden and the United Kingdom. This database comprises mortality data by year, 3-digit ICD-codes (revisions 8, 9 and 10), sex and 5-year age group, that were obtained from the statistical offices of each country. Known discontinuities due to changes in ICD-coding and recording were reviewed. Then, a new methodology was developed, based on the Polydect method,20 to identify abrupt changes in mortality, i.e. “jumps”. Correction factors were applied to overcome the effect of these changes.21
Remaining (real) discontinuities in mortality trends were sought using joinpoint models based on linear spline regression (with the R software), which identifies “knots” where the trend changes significantly.22,23 This program also estimates the Percent Annual Change (PAC) for periods between knots. This enabled trends to be compared across countries and with the timing of introduction of innovations. First, we studied deaths at all ages and then limited the age range to ages from 0 to 74 in order to see in a sensitivity analysis whether this changed the results. To choose one age cut-off point for all causes of death is arbitrary, but we found two standard age limits in previous studies (65 and 75) and we choose the upper one because of rising life expectancy and improved effectiveness of medical treatments in higher ages. As we are interested in period effects, prior to running the analysis any possible cohort effects were sought by means of age-period-cohort (APC) analysis. We first examined whether favorable changes in mortality trends coincide with the period of expected mortality decline due to the introduction of a medical innovation. If a knot fell within this period, this was defined as a “match”. Inevitably, some matches will occur by chance so we tested whether the number of matches found is significantly higher than chance. To draw a conclusion about associations between innovations and mortality, we counted the countries that show a match for a condition. If two thirds of all countries with valid data show the association, we interpreted this as evidence for an effect.
Delphi procedureDespite taking a systematic and structured approach to the identification of potential indicators of amenable mortality, we recognize that a degree of judgment is still required to assess whether the conditions were useful in practice. To incorporate this judgment we used the Delphi method, in which individuals were asked their view of the appropriateness of the causes identified, supplemented by others that failed on one or a few criteria as well as conditions that, in the judgment of the investigators, are clearly not appropriate. We included 23 individuals from 16 countries who were either producers or users of evidence on health systems performance, seeking participation by both genders and health professionals and non-health professionals. The method involved two rounds and in each the respondents were asked to score the conditions on a point scale (1=inappropriate, 9=appropriate). Following previous research using nominal group methods to assess agreement, consensus was deemed to exist when all scores (except single outliers) were within a three point range. In the first round, individuals were presented with a summary, for each condition, of all information gathered in earlier steps. In the second round they were given the range of first round scores, anonymized except for their own.
Electronic atlas on amenable mortalityAll indicators considered at different stages of the project, as well as indicators proposed by other projects on amenable mortality were made publically available through an interactive electronic atlas, constructed with the InstantAtlas software, documenting variations in amenable mortality (45 causes of death) between 31 European countries for the period 2001-2009 (http://survey.erasmusmc.nl/amiehs). Age-standardized mortality trends are presented for males and females separately using the European Standard Population.
ResultsFigure 2 shows the stepwise selection of causes of death based on the criteria outlined above. Of 644 three-digit ICD codes, 160 codes had 100 or more deaths in 2000 in the UK and, of those, 54 exhibited a decline in age-standardized mortality of 30% or more. The exclusion of 40 codes for different reasons shown in Figure 2 resulted in a preliminary set of 14 conditions and 18 related interventions which are shown in Table 2 and are taken forward to subsequent steps.

Causes of death (and related interventions) passing the selection criteria.
| Condition | ICD-9-code | ICD-10-code | Intervention |
| HIV | 042-044 | B20-B24 | Antiretroviral treatment |
| Malign. colorectal neoplasm | 153-154 | C18-C21 | Colonscopy |
| Oxaliplatin treatment | |||
| Malign. neoplasm of cervix uteri | 180 | C53 | Introduction cervical screening |
| Hodgkins disease | 201 | C81 | High dose therapy and peripheral blood stem cell transplantation |
| Malign. Neoplasm of breast | 174 | C50 | Mammography |
| Tamoxifen | |||
| Malignant neoplasm of testes | 186 | C62 | Treatment with cisplatin |
| Leukaemia | 204-208 | C91-C95 | Improved treatment (or management of the disease process and its complications for leukaemia patients <45 years) |
| Rheumatic heart disease | 390-398 | I00-I09 | Artificial valve replacement |
| Hypertension | 401-404 | I10-I13 | Increased number of patients treated |
| Ischaemic heart disease | 410-414 | I20-I25 | β-blockers |
| Coronary care units | |||
| Heart failure | 428-429 | I50-I51 | ACE inhibitors |
| Cerebrovascular disease | 430-438 | I60-I69 | Treatment of hypertension |
| Intensive management of acute stroke (CT-scan, thrombolytic therapy, surgical treatment of aneurysms in subarachnoid haemorrhage) | |||
| Peptic ulcer | 431-432 | K25-K26 | Cimetidine |
| Renal failure | 584-586 | N17-N19 | Cyclosporin |
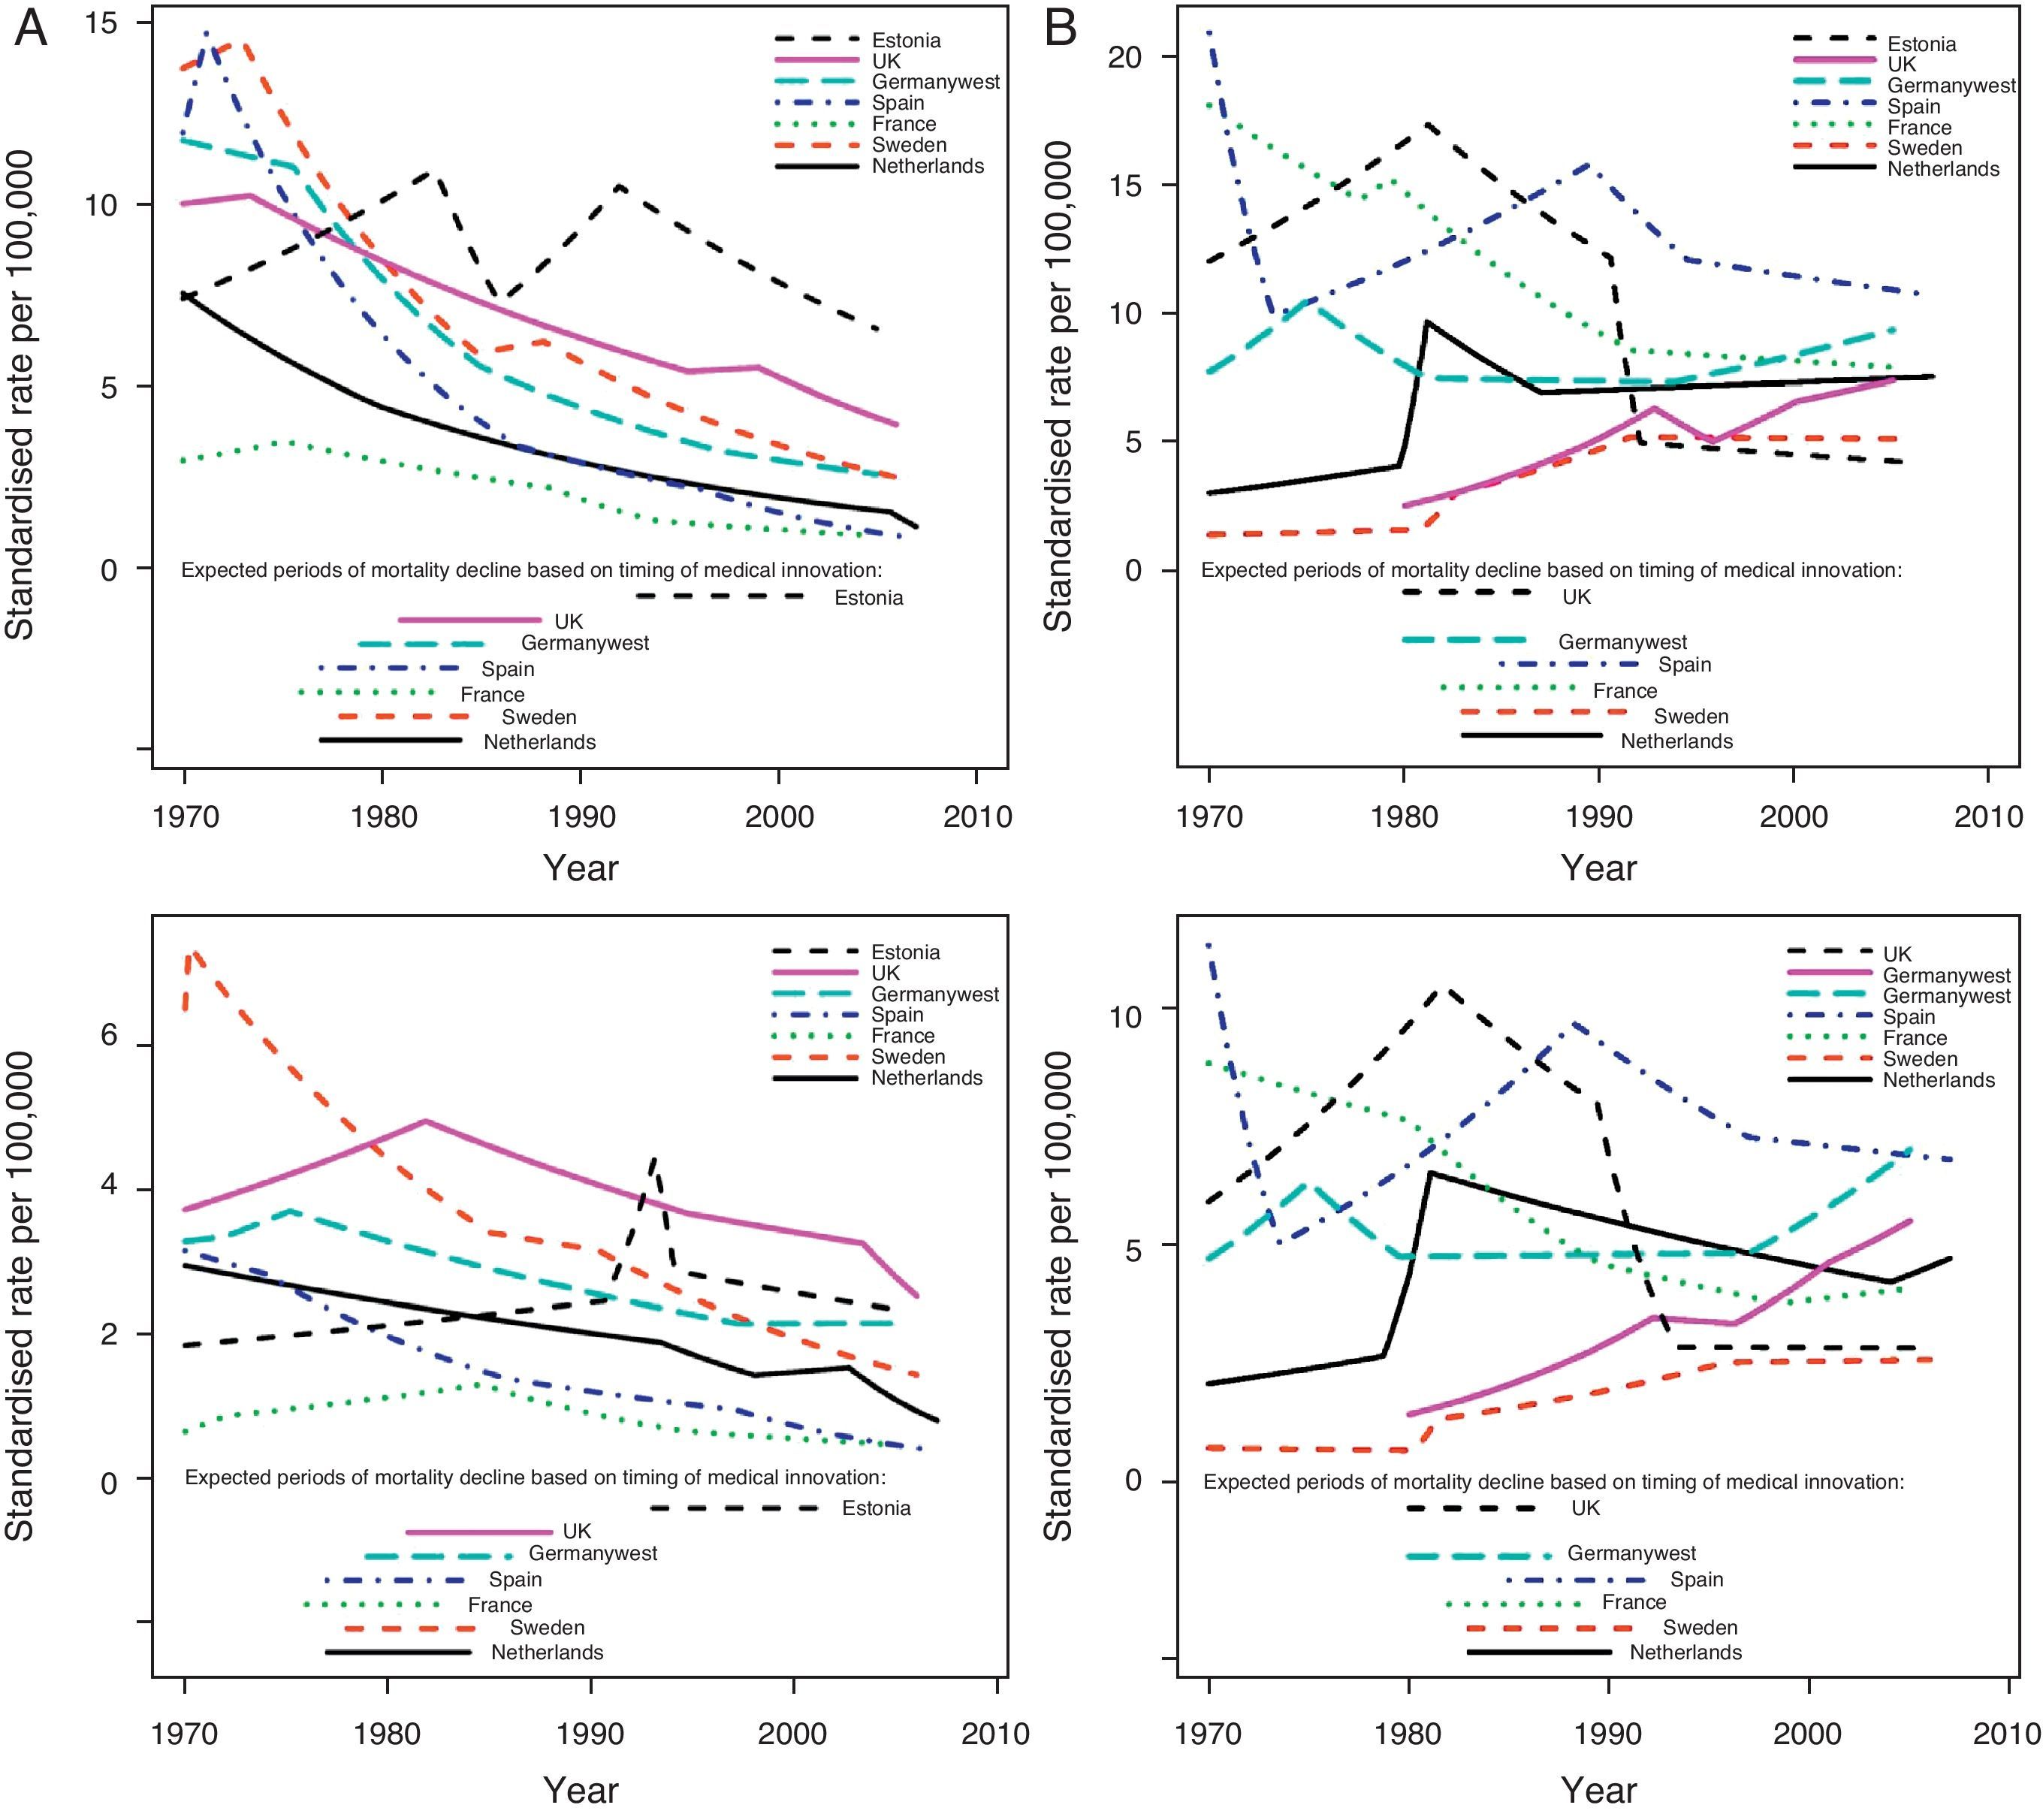
Figure 3 shows a graphical representation of the validation analysis for peptic ulcer and renal failure. In most countries mortality from peptic ulcer (Fig. 3A) has decreased throughout the study-period. Only for men in France and for women in the UK there is a positive change in mortality that falls into the expected period of mortality decline, whereas for five countries we do not see this association. According to our criteria this example would lead to the conclusion that there is no sufficient evidence that population level mortality from peptic ulcer has been responsive to the introduction of Cimetidine. Mortality trends from renal failure (Fig. 3B) are very diverse across the countries. We find increasing and decreasing trends, as well as trends that peak in the 1980s. Renal failure could not be studied in Estonia because of incomparable ICD coding. In the UK and Spain mortality declines in the expected period for both men and women. In Sweden we see this coincidence only for men. In three countries we do not see this match and therefore there is no sufficient evidence that population level mortality from renal failure has been responsive to the introduction of cyclosporin. The results of this mortality trend analysis for these two conditions serve as examples for the similar analysis of all 14 conditions with similar results: overall we have not found clear evidence for an association between innovations in health care and changes in mortality.

A) Estimated mortality trends from peptic ulcer and expected periods of mortality decline based on the introduction of cimetidine (upper panel men; lower panel women). B) Estimated mortality trends from renal failure and expected periods of mortality decline based on the introduction of cyclosporin (upper panel man; lower panel women).
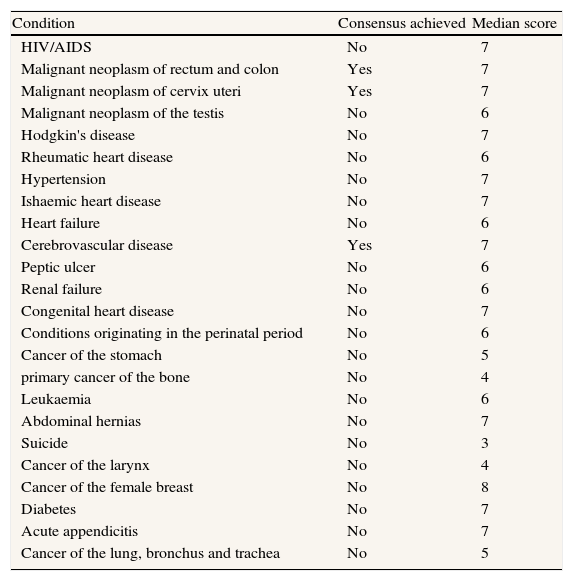
Table 3 shows the results of the Delphi procedure. Only for three conditions consensus could be reached. These were those where all scores (except single outliers) were within a three point range.
Results of the Delphi procedure.
| Condition | Consensus achieved | Median score |
| HIV/AIDS | No | 7 |
| Malignant neoplasm of rectum and colon | Yes | 7 |
| Malignant neoplasm of cervix uteri | Yes | 7 |
| Malignant neoplasm of the testis | No | 6 |
| Hodgkin's disease | No | 7 |
| Rheumatic heart disease | No | 6 |
| Hypertension | No | 7 |
| Ishaemic heart disease | No | 7 |
| Heart failure | No | 6 |
| Cerebrovascular disease | Yes | 7 |
| Peptic ulcer | No | 6 |
| Renal failure | No | 6 |
| Congenital heart disease | No | 7 |
| Conditions originating in the perinatal period | No | 6 |
| Cancer of the stomach | No | 5 |
| primary cancer of the bone | No | 4 |
| Leukaemia | No | 6 |
| Abdominal hernias | No | 7 |
| Suicide | No | 3 |
| Cancer of the larynx | No | 4 |
| Cancer of the female breast | No | 8 |
| Diabetes | No | 7 |
| Acute appendicitis | No | 7 |
| Cancer of the lung, bronchus and trachea | No | 5 |
Note: a score of 1-3 indicates that the cause is considered inappropriate as an indicator of health system performance, while that from 7-9 indicates that it is appropriate.
The present study is based on a rigorous process of constructing an up-to-date list of indicators of amenable mortality. We demonstrate how we got from all 644 three-digit ICD-9 codes to a preselection of 14 causes of death using explicit selection criteria. With two example conditions we illustrate the subsequent empirical validation analysis which shows that the association between medical innovations and changes in mortality is modest. Our Delphi exercise shows consensus among experts on three amenable conditions. This study uses empirical evidence to validate possible amenable mortality indicators, whereas in the past such indicators have often been selected by expert opinion only. The findings from this project help to assess and compare the performance of the health systems.
Some limitations need to be addressed: we focus on innovations introduced after 1970. Some major innovations like the introduction of antibiotics have taken place before and are therefore not considered. We also focus on medical innovations. Yet improvements in population health due to health care reflect three factors: innovations, improvement in the quality with which they are applied and expanded coverage. At the level of international comparisons over time it is not possible to take account of the other factors given the absence of adequate data. Third, we are looking at the effect of individual interventions, rather as if they are “magic bullets”, although in reality many health gains are the consequence of incremental improvements. Fourth, in seeking evidence of the effect on mortality of specific innovations, we were limited as few trials have mortality as an end point, instead using intermediate measures. Fifth, we were constrained by the paucity of high quality observational studies attributing health gains to particular innovations. Sixth, although there is no alternative to using ICD codes at the three digit level, they are not designed for the purpose we are using them and the potential benefits of a therapeutic innovation may be distributed among many codes, such as those related to safer anesthesia. Finally, we adopt a narrow definition of the health system, excluding intersectoral actions. This is inevitable if using this method. A broader definition of the health care system may define more causes of death as potentially amenable. Not as a limitation of the amenable mortality approach, but as a factor that complicates the interpretation of observed trends in mortality, we want to mention that many factors other than innovations in health care influence mortality. Given the difficulty in precisely measuring these factors, it will remain a challenge to interpret mortality changes on the population level as a consequence of the particular change in health care. Socioeconomic differences in the trends of mortality and in the diffusion of medical innovation may hide socioeconomic differences in amenability. This could not be taken into account in this study. A recent study suggests that socioeconomic differences in amenable mortality do not reflect differences in access or quality of care.24
In the AMIEHS project the concept of amenable mortality is addressed in a completely different manner from previous studies by starting from all causes of death and working down to a limited number. Secondly, our selection of indicators is linked directly to changes in health care practice, addressing a previous criticism of the concept of amenable mortality. The indicators we identified help to highlight shortcomings in health care, but mortality rates from amenable causes must be used with caution as indicators of health care effectiveness in international comparisons. Elsewhere we suggest two possible alternative measures of amenable mortality25 and more in-depth analyses will be needed to identify the specific failures in health care systems. For policy makers the indicators identified in this study will offer the opportunity to put extra attention into specific causes of death. For researchers these indicators are hotspots giving rise to new investigations in the future.
There is widespread consensus on the need for better indicators of the effectiveness of health care. This gave rise to the concept of ‘avoidable’ or ‘amenable’ mortality in the 1970s. However, the validity of certain causes of death as indicators of the effectiveness of health care has never been formally and systematically demonstrated.
What does this study add to the literature?The innovation developed in the project “Amenable mortality in the European Union: towards better indicators for the effectiveness of health systems” (AMIEHS) is a rigorous new approach to the concept of amenable mortality that includes empirical validation. We describe the study design, discuss our selection criteria, list 14 causes of death passing these criteria, and present two examples of the empirical validation that assessed whether the introduction of innovations in health care coincided with declines in mortality from potentially amenable causes in seven European countries.
R. Hoffmann and I. Plug are work package leaders in the project and drafted the manuscript. B. Khoshaba contributed to the analysis and to drafting the manuscript. M. McKee participated in the design of the study, performed analysis and contributed to the manuscript. J.P. Mackenbach participated in the design of the study and contributed to the manuscript. All authors read and approved the final manuscript.
FundingThe AMIEHS project -Amenable mortality in the European Union: towards better indicators for the effectiveness of health systems- has received funding from the European Union through the Executive Agency for Health and Consumers (EAHC) (agreement number 2007106).
Conflict of interestsNone.
The AMIEHS working groups consists of the authors and Grégoire Rey, Eric Jougla, Ragnar Westerling, Caspar W.N. Looman, José L Alfonso-Sánchez, Kersti Pärna, Katrin Lang and Wolfgang Hellmeier.


