


Previous research has found persistent socioeconomic inequalities in health outcomes at the national level, with different patterns after the economic crisis. However, inequalities in urban areas are also important. This study analyses socioeconomic inequalities in self-assessed health and mental health in the city of Barcelona.
MethodRepeated cross-sectional design using quinquennial data from the Barcelona Health Surveys carried out in 2001, 2006, 2011 and 2016 for the population older than 22 years. Robust Poisson regressions models were used to compute socioeconomic gradients and relative (RII) and slope indexes of inequality (SII) by occupational social class, with stratification by sex. RII and SII were also obtained with further adjustment by employment situation.
ResultsA consistent socioeconomic gradient was found for all years except for 2011. Relative and absolute inequalities followed a V-shape, showing a drop during the economic crisis but widening thereafter to recover pre-crisis figures for self-assessed health and widening for mental health, in both relative and absolute terms in 2016. Adjustment for employment situation reduces inequalities but a large part of these inequalities remains, with variability across years.
ConclusionsThe lasting effects of the 2008 economic crisis and the austerity programmes imposed since then may have contributed to the persistence of socioeconomic inequalities in self-assessed health and the widening of those for mental health.
La investigación previa ha reportado desigualdades socioeconómicas persistentes en salud en el territorio nacional, con diferentes patrones después de la crisis económica. Sin embargo, las desigualdades en las áreas urbanas son también importantes. Este estudio analiza las desigualdades en salud autopercibida y salud mental en la ciudad de Barcelona.
MétodoDiseño de corte transversal con datos quinquenales de la Encuesta de Salud de Barcelona llevada a cabo en 2001, 2006, 2011 y 2016 para la población mayor de 22 años. Se utilizan modelos de regresión robusta de Poisson para calcular el gradiente social y los riesgos relativo (RII) y absoluto de desigualdad (SII) por clase social ocupacional, estratificando por sexo. El RII y el SII se obtienen también ajustando adicionalmente por situación laboral.
ResultadosSe encuentra un gradiente social para todos los años excepto para 2011. Se observan desigualdades relativas y absolutas en forma de V para la salud autopercibida, con una reducción durante la crisis económica, pero recuperándose a partir de esta para volver a los valores anteriores a la crisis para salud autopercibida y ampliándose para la salud mental, tanto en términos relativos como absolutos, en 2016. Ajustar por la situación laboral reduce las desigualdades, pero una gran parte de estas desigualdades permanece, con variabilidad, en los años.
ConclusionesLos efectos duraderos de la crisis económica de 2008 y los programas de austeridad impuestos desde entonces pueden haber contribuido a la persistencia de las desigualdades socioeconómicas en salud autopercibida y a su ampliación en la salud mental.
Socioeconomic inequalities in health have been widely analysed at the national and cross-national level but there is less evidence at the urban level, even though inequalities in cities may be as important as those in countries.1 Large urban areas are a setting for global/local dynamics, from climate change to job delocalisation, migration and housing bubbles potentially affecting health inequalities. The aim of this study was to provide evidence of trends in socioeconomic inequalities in self-assessed health and mental health during the last 16 years in the urban area of Barcelona (Spain).
A common feature of socioeconomic inequalities in self-assessed health, at both the cross-national and national level, is the persistence of inequalities across European countries or small oscillations without trend.2 Recent trends in socioeconomic health inequalities have inevitably dealt with the effects of the 2008 economic crisis, and inequalities since then have seemed unchanged. For instance, one study using national surveys reported that absolute inequalities by education and occupation in self-assessed health were mostly constant across 17 European countries in 1990 and 2010, and while relative inequalities increased, almost no country consistently experienced a significant decline in either absolute or relative inequalities.3 Another study analysing health inequalities by education level across 27 European countries observed no discernible short-term impact of the 2008 crisis at the population level.4 Similarly, one study using the European Union of Income and Living Conditions (EU-SILC) panel from 2005 to 2011 did no find differences before and after the economic crisis among low educated and unemployed.5 Several national experiences also show the persistence of socioeconomic health inequalities. For instance, in Japan, relative and absolute socioeconomic inequalities by household income in self-assessed health narrowed or remained stable between 1986 and 2007, despite the economic stagnation during the 90s and adverse social changes.6 Similarly, inequalities by education level and income also appear to persist in Germany during the period 2003-2012 after the recession of 2008.7 In England, self-perceived health (and mental health) remained stable from 1996 to 2009, with no evidence of widening socioeconomic inequalities.8 However, another study using the EU-SILC panel data but for the recovery years from 2011 to 2013 found steeper declines in self-assessed health among unemployed and single mothers and no different by education level.9 These results suggest that the effects of the economic crisis may disproportionally affect specific social groups and with larger effects with elapsed time since the start of the economic crisis. In Spain, the evidence for trends in self-assessed health inequalities is not clear cut.10 One study using the National Health Survey (NHS) for year 2006 and 2011 reported increasing inequalities in self-assessed health by education level.11 A worse trend in self-assessed health among unemployed was also reported using the Living Conditions Survey for years 2007 and 2011.12 A finding that was not confirmed applying matching technics to data from NHS for the years 2006 and 2011.13 Interestingly, a study including four waves 2005, 2008, 2011, 2014 of the Bank of Spain's Survey of Household Finances found worse self-assessed health trends among family types characterized with a low job intensity.14 Again, the results point that the economic crisis may have exacerbated inequalities through weakening the labour market position of specific social groups for which economic recovery fades away.
Unlike the persistent inequalities reported in self-assessed health, mental health can be more sensitive to situations of short-term employment and material deprivation. There is an extensive literature on mental health trends since the economic recession. Systematic reviews have concluded a worsening of the mental health trends since the economic crisis.15 As expected, a higher risk of psychosocial problems has been found across European countries among unemployed persons, those with a lower educational level and those living in urban areas.16 However, these recent increases in mental health problems can only partially be explained by trends in unemployment and wages. It has been alleged that the austerity measures have contributed to the widening in mental health inequalities.17 For instance, in England, relative inequalities in mental health reduced following the recession, between 2008 and 2010, but increased significantly more between the recovery years 2009 and 2013 and seemed to widen thereafter.18 In Spain, since the 2008 economic crisis, mental health has also clearly deteriorated.19 The increase in inequalities is largely due to a worse trend among those in the lowest socioeconomic position. At national level, using two waves of the national health survey for years 2006 and 2012, increasing inequalities have been found by social class among men and long-term unemployed.13,20,21 At regional level, it has been found larger adverse effects among those with lower education level in Andalusia for years 2007 and 2012,22 and using four waves of the Basque Health Survey from 1997 to 2013, an increase in relative inequalities by social class among men.23
This study contributes to the existing literature by extending the period of analysis and showing its evolution at local level. The objective was to analyse socioeconomic inequalities by occupational social class in the self-assessed health and mental health of the Barcelona population by using data from a quinquennial survey from 2001 to 2016.
MethodDesign and study populationData were drawn from four cross-sectional repeated waves of the Barcelona Health Survey (BHS) for the years 2001 and 2006 pre-crisis, 2011 crisis, and 2016 post-crisis. The BHS aims to periodically (i.e., every 5 years) study the health status, health-related behaviours, and use of health services among the non-institutional population resident in the city of Barcelona. The sample unit consisted of randomly selected individuals from the city. All non-responders were substituted by randomly previously-selected persons with the same characteristics (age, sex, and area) until the target sample size was achieved. The information was collected by trained personnel through face-to-face interviews. For the purposes of this study, we excluded individuals younger than 23 years to ensure potential compliance of the educational/training period. The final sample size was 7740 for 2001, 2983 for 2006, 3249 for 2011 and 3252 for 2016.
Variables1) Dependent variables
Self-assessed health. Participants were asked about their perceived general health using the question: “How is your health in general? There were five possible answers that were dichotomized in good health status (categories “excellent‿, “very good‿ and “good‿) and poor health (“fair‿ and “bad‿).
Mental health was measured with the 12-item version of the General Health Questionnaire (GHQ-12). This questionnaire focuses on temporary problems, occurring in the last 30 days, and is a widely used screening instrument to detect risk of current, diagnosable psychiatric disorders. Questions were answered on a 4-point Likert scale (from 1 to 4). Following recommendations, we used a 2-point scoring method, rating a problem as absent (0) or present (1). Participants scoring 3 or more were classified as having poor mental health.24
2) Independent variables
Occupational social class is a measure of socioeconomic position based on a graded hierarchy of occupations ranked according to skill. The exact coding is based on the 5-category classification proposed by the Spanish Society of Epidemiology:25 occupational social class (OSC) I, managers of firms with ≥10 employees and professionals with a university degree (the reference category); OSC II, managers of firms with<10 employees and professionals without a university degree; OSC III, intermediary occupations and support; OSC IV, supervisors and semi-qualified workers; OSC V, unskilled workers; where OSC I represents the highest and OSC V the lowest socioeconomic position. Hereafter, non-manual class-term is used to refer OSCs I and II and manual class as OSC from III to V. Respondents who never had an occupation were classified according to the social class of the reference person of the household.
3) Control variables
Control variables include age, marital status in three categories: being married as the base category, single, and the third being separated, widowed or divorced, being born in a foreign country (yes or no), and employment status in six categories (employed as the reference category, homemaker, unemployed, student, retired and disabled). All models were stratified by sex.
Data analysisWe conducted a descriptive statistical analysis and calculated age-standardised prevalences with confident intervals in poor self-assessed health and mental health. To test for associations between health outcomes and the occupational class for each sex and survey year, the relative risk was obtained by running a robust Poisson regression with the occupational class as the categorical variable. As a summary measure of socioeconomic inequalities, the relative index of inequality (RII) and the slope index of inequality (SII) were computed. The RII was also obtained by running a robust Poisson regression model but fitted against the midpoints of the cumulative frequency of occupational class instead of its categorical original form. The robust Poisson regression for binary data has been proved to yield reliable RII estimates and has the advantage over the binomial model of minimizing omitted variable bias.26 Absolute differences are measured by the SII corresponding to the difference between the estimated prevalences at the two extremes of occupational class of the fitted model. The baseline analysis was adjusted for the sociodemographic variables of age, marital status and foreign birth. A second model was adjusted for employment situation to assess its potential mediating role in the RII and SII and to account for the changing composition of the population and work force during the study period. All computations were performed with the statistical software Stata v15.
The syntax used and the detailed regression results are provided as supplementary material in online Appendix.
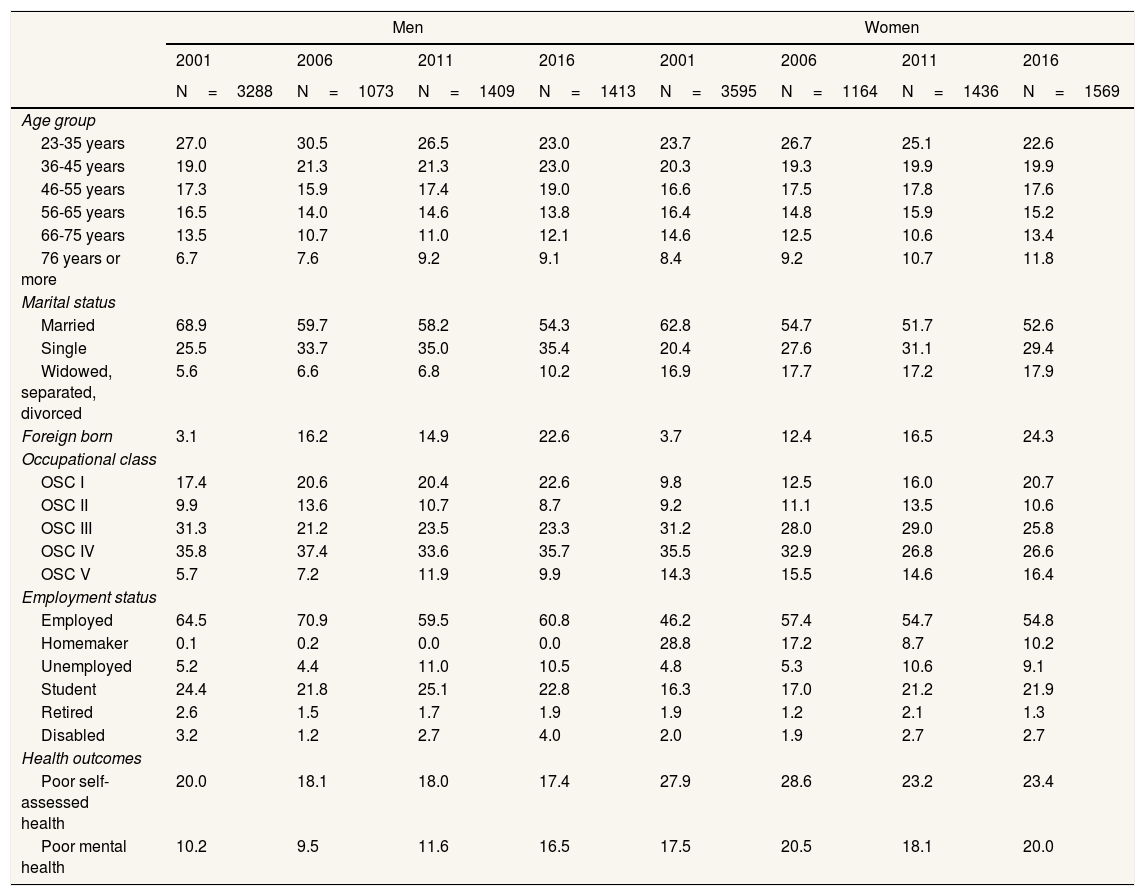
ResultsDemographic and socioeconomic changes during the study period are shown in Table 1. Comparing the first and final year, there was an upward trend in the share of the population older than 75 years, unmarried people, those in the highest occupational class, unemployed persons and a large increase in the share of immigrant population. The trends for health outcomes were favourable for poor self-assessed health (decreasing by 2.6% for men and 4.5% for women), but were unfavourable for poor mental health (increasing by 6.3% for men and 2.5% for women).
Sociodemographic and health characteristics, Barcelona 2001-2016.
| Men | Women | |||||||
|---|---|---|---|---|---|---|---|---|
| 2001 | 2006 | 2011 | 2016 | 2001 | 2006 | 2011 | 2016 | |
| N=3288 | N=1073 | N=1409 | N=1413 | N=3595 | N=1164 | N=1436 | N=1569 | |
| Age group | ||||||||
| 23-35 years | 27.0 | 30.5 | 26.5 | 23.0 | 23.7 | 26.7 | 25.1 | 22.6 |
| 36-45 years | 19.0 | 21.3 | 21.3 | 23.0 | 20.3 | 19.3 | 19.9 | 19.9 |
| 46-55 years | 17.3 | 15.9 | 17.4 | 19.0 | 16.6 | 17.5 | 17.8 | 17.6 |
| 56-65 years | 16.5 | 14.0 | 14.6 | 13.8 | 16.4 | 14.8 | 15.9 | 15.2 |
| 66-75 years | 13.5 | 10.7 | 11.0 | 12.1 | 14.6 | 12.5 | 10.6 | 13.4 |
| 76 years or more | 6.7 | 7.6 | 9.2 | 9.1 | 8.4 | 9.2 | 10.7 | 11.8 |
| Marital status | ||||||||
| Married | 68.9 | 59.7 | 58.2 | 54.3 | 62.8 | 54.7 | 51.7 | 52.6 |
| Single | 25.5 | 33.7 | 35.0 | 35.4 | 20.4 | 27.6 | 31.1 | 29.4 |
| Widowed, separated, divorced | 5.6 | 6.6 | 6.8 | 10.2 | 16.9 | 17.7 | 17.2 | 17.9 |
| Foreign born | 3.1 | 16.2 | 14.9 | 22.6 | 3.7 | 12.4 | 16.5 | 24.3 |
| Occupational class | ||||||||
| OSC I | 17.4 | 20.6 | 20.4 | 22.6 | 9.8 | 12.5 | 16.0 | 20.7 |
| OSC II | 9.9 | 13.6 | 10.7 | 8.7 | 9.2 | 11.1 | 13.5 | 10.6 |
| OSC III | 31.3 | 21.2 | 23.5 | 23.3 | 31.2 | 28.0 | 29.0 | 25.8 |
| OSC IV | 35.8 | 37.4 | 33.6 | 35.7 | 35.5 | 32.9 | 26.8 | 26.6 |
| OSC V | 5.7 | 7.2 | 11.9 | 9.9 | 14.3 | 15.5 | 14.6 | 16.4 |
| Employment status | ||||||||
| Employed | 64.5 | 70.9 | 59.5 | 60.8 | 46.2 | 57.4 | 54.7 | 54.8 |
| Homemaker | 0.1 | 0.2 | 0.0 | 0.0 | 28.8 | 17.2 | 8.7 | 10.2 |
| Unemployed | 5.2 | 4.4 | 11.0 | 10.5 | 4.8 | 5.3 | 10.6 | 9.1 |
| Student | 24.4 | 21.8 | 25.1 | 22.8 | 16.3 | 17.0 | 21.2 | 21.9 |
| Retired | 2.6 | 1.5 | 1.7 | 1.9 | 1.9 | 1.2 | 2.1 | 1.3 |
| Disabled | 3.2 | 1.2 | 2.7 | 4.0 | 2.0 | 1.9 | 2.7 | 2.7 |
| Health outcomes | ||||||||
| Poor self-assessed health | 20.0 | 18.1 | 18.0 | 17.4 | 27.9 | 28.6 | 23.2 | 23.4 |
| Poor mental health | 10.2 | 9.5 | 11.6 | 16.5 | 17.5 | 20.5 | 18.1 | 20.0 |
OSC: occupational social class, with OSC I the more advantaged and OSC V the less advantaged social class.
Age-standardised prevalences with confidence intervals in poor self-assessed health and mental health by occupational class, sex and years are shown in Table 2. The broad picture is that in the post-crisis period (2016) inequality levels recovered from the pre-crisis periods, with 2011 —during the economic crisis— being the year when inequalities reduced due to a simultaneous increase in adverse health status in non-manual classes and a reduction of poor health status in the manual classes. For men, the gap in poor self-assessed health by class squeezes in 2011 (6.0%) but widens again in 2016 (14.3%) below the pre-crisis gap (20.1% for 2001 and 20.7% for 2006). The gap in poor mental health remains fairly stable from 2001 to 2011 (between 6.2% and 8.0%) but reaches a maximum in 2016 (20.4%). Among women, the gap in poor self-assessed health by class follows a similar pattern of that of men, squeezing in 2011 (6.7%) but widening again in 2016 (23.4%) below to the pre-crisis gap (29.2% for 2001 and 28.6% for 2006). The gap in mental health also reaches a minimum in 2011 (1.6%) but widens again in 2016 (16.6%) below to pre-crisis levels in 2006 (19.1%). For men and women, the increases in 2016, specially for poor mental health, are driven by the worsening among manual classes.
Age-adjusted prevalences and 95% confidence intervals of poor self-assessed health and mental health by occupational social class and sex, Barcelona, 2001-2016.
| 2001 | 2006 | 2011 | 2016 | |
|---|---|---|---|---|
| Men | ||||
| Poor self-assessed health | ||||
| OSC I | 9.3 (7.0-11.7) | 10.2 (6.3-14.2) | 14.1 (10.1-18.1) | 12.0 (8.6-15.5) |
| OSC II | 9.6 (7.3-11.9) | 15.5 (11.3-19.7) | 23.6 (18.9-28.3) | 16.0 (11.4-20.6) |
| OSC III | 20.1 (17.3-22.9) | 17.9 (12.2-23.6) | 19.3 (14.4-24.3) | 17.2 (12.5-21.9) |
| OSC IV | 27.9 (24.6-31.3) | 22.9 (17.5-28.4) | 18.8 (14.1-23.5) | 19.8 (15.3-24.4) |
| OSC V | 29.4 (25.4-33.5) | 30.9 (24.4-37.5) | 20.1 (16.3-23.8) | 26.3 (21.7-30.8) |
| Poor mental health | ||||
| OSC I | 6.8 (4.8-8.8) | 7.4 (4.0-10.9) | 10.6 (7.1-14.1) | 8.4 (5.4-11.3) |
| OSC II | 10.8 (8.3-13.2) | 10.0 (6.5-13.5) | 12.0 (8.4-15.5) | 9.2 (5.7-12.9) |
| OSC III | 9.6 (7.5-11.6) | 11.1 (6.4-15.8) | 8.3 (4.9-11.8) | 14.7 (10.4-19.2) |
| OSC IV | 11.7 (9.3-14.1) | 9.3 (5.6-13.1) | 11.9 (7.9-15.7) | 20.1 (15.6-24.8) |
| OSC V | 14.8 (11.7-17.9) | 13.6 (8.7-18.4) | 18.4 (14.7-22.0) | 28.8 (24.1-33.5) |
| Women | ||||
| Poor self-assessed health | ||||
| OSC I | 12.8 (9.8-15.7) | 14.4 (9.5-19.4) | 20.3 (15.9-24.8) | 11.3 (8.5-14.2) |
| OSC II | 16.2 (13.9-19.9) | 18.1 (13.1-23.1) | 16.0 (12.2-19.9) | 18.9 (14.5-23.2) |
| OSC III | 19.8 (16.9-22.8) | 23.8 (18.0-29.6) | 23.5 (19.5-28.5) | 22.2 (17.2-27.2) |
| OSC IV | 32.5 (29.2-35.8) | 32.6 (26.5-38.7) | 24.8 (19.2-30.4) | 26.7 (21.2-32.3) |
| OSC V | 42.0 (38.2-45.8) | 43.0 (36.6-49.5) | 27.0 (21.8-32.3) | 34.7 (29.6-39.8) |
| Poor mental health | ||||
| OSC I | 11.2 (8.4-14.0) | 11.4 (7.0-15.9) | 15.9 (11.9-19.9) | 12.4 (9.4-15.4) |
| OSC II | 16.5 (13.5-19.5) | 14.4 (9.8-19.0) | 13.5 (9.9-17.1) | 10.4 (7.0-13.9) |
| OSC III | 15.5 (12.8-18.1) | 19.7 (14.3-25.2) | 20.9 (16.1-25.8) | 15.8 (11.4-20.2) |
| OSC IV | 18.3 (15.5-21.0) | 22.8 (17.4-28.2) | 19.5 (14.4-24.7) | 27.2 (21.6-32.8) |
| OSC V | 23.1 (19.8-26.4) | 30.5 (24.5-36.5) | 17.5 (13.0-22.1) | 29.0 (24.1-33.8) |
OSC: occupational social class, with OSC I the more advantaged and OSC V the less advantaged social class.
Tables 3 and 4 show the relative risk by occupational class, the relative index of inequality and the absolute difference of poor health outcomes and year for men and women. The first shows a socioeconomic gradient for most years, with the population in the lower occupational classes having a higher risk of experiencing poor self-perceived and mental health than the higher ones. Both the RII and the SII for self-assessed health followed this V-shape trend of vanishing inequalities during the economic crisis and for mental health even widened again in 2016. For poor self-assessed health, the RII (95% confidence interval) decreased among men, from 3.42 (2.61-4.47) in 2001 to a non-significant value in 2011, but increased to 2.83 (1.81-4.42) in 2016. The same occurred for poor mental health, from 2.04 (1.37-3.03) in 2001 to a non-significant value in 2011, and rose again to 4.02 (2.43-6.64) in 2016. For women, the RII for poor self-assessed health decreased from 3.16 (2.55-3.91) in 2001 to 1.66 (1.14-2.40) in 2011 and rose again to 3.92 (2.67-5.76) in 2016. For poor mental health, the RII decreased from 1.83 (1.39-2.41) in 2001 to a non-significant value in 2011 and rose again to 3.55 (2.31-5.47) in 2016. For men and women, absolute inequalities in self-assessed health also followed a V-shape and widened for mental health in 2016. When we adjusted for employment situation, inequalities for self-assessed health and mental health were reduced for both men and women but a large share of inequality remains with variability across the years.
Risk of poor self-assessed health and mental health by occupational class, relative index of inequality (RII) and absolute difference (SII) with 95% confident intervals for men, Barcelona, 2001-2016.
| 2001 | 2006 | 2011 | 2016 | |
|---|---|---|---|---|
| Poor self-assessed healtha | ||||
| OSC I | 1 (ref.) | 1 (ref.) | 1 (ref.) | 1 (ref.) |
| OSC II | 0.97 (0.58-1.61) | 1.37 (0.72-2.60) | 1.41 (0.91-2.20) | 1.38 (0.75-2.52) |
| OSC III | 2.05d (1.51-2.79) | 1.82b (1.11-2.97) | 1.47b (1.02-2.11) | 1.55b (1.03-2.32) |
| OSC IV | 2.78d (2.07-3.73) | 2.29d (1.48-3.55) | 1.39 (0.99-1.97) | 1.84c (1.28-2.64) |
| OSC V | 2.78d (1.94-4.00) | 3.13d (1.82-5.37) | 1.54b (1.02-2.34) | 2.79c (1.81-4.29) |
| RII base | 3.42d (2.61-4.47) | 3.34b (2.04-5.49) | 1.45 (0.98-2.14) | 2.83d (1.81-4.42) |
| SII base | 19.63d (14.84-24.43) | 19.90d (10.70-29.11) | 4.62 (−1.83-11.06) | 15.52d (7.98-23.07) |
| RII adjusted | 2.75d (2.1-3.59) | 3.39d (2.04-5.62) | 1.22 (0.82-1.8) | 2.08c (1.34-3.24) |
| SII adjusted | 12.25d (8.29-16.20) | 17.20d (8.63-25.77) | 1.81 (−3.37-6.99) | 7.54c (2.62-12.46) |
| Poor mental healtha | ||||
| OSC I | 1 (ref.) | 1 (ref.) | 1 (ref.) | 1 (ref.) |
| OSC II | 1.46 (0.91-2.33) | 1.23 (0.57-2.68) | 1.11 (0.63-1.97) | 1.28 (0.64-2.55) |
| OSC III | 1.44 (0.98-2.12) | 1.42 (0.74-2.73) | 0.80 (0.47-1.37) | 1.78b (1.09-2.93) |
| OSC IV | 1.75c (1.22-2.53) | 1.25 (0.67-2.32) | 1.03 (0.66-1.62) | 2.40d (1.55-3.73) |
| OSC V | 2.22c (1.36-3.62) | 1.84 (0.83-4.05) | 1.75b (1.07-2.87) | 3.43d (2.09-5.63) |
| RII base | 2.04d (1.37-3.03) | 1.48 (0.71-3.08) | 1.64 (0.90-2.98) | 4.02d (2.43-6.64) |
| SII base | 6.12c (2.47-9.73) | 3.72 (−3.04-10.48) | 4.72 (−1.16-10.61) | 20.10d (11.14-29.06) |
| RII adjusted | 1.67b (1.12-2.48) | 1.41 (0.68-2.91) | 1.28 (0.69-2.35) | 3.17d (1.89-5.31) |
| SII adjusted | 4.08b (0.69-7.46) | 2.76 (−3.09-8.61) | 2.42 (−2.75-7.60) | 12.54d (5.45-19.63) |
Risk of poor self-assessed health and mental health by occupational class, relative index of inequality (RII) and absolute difference (SII) with 95% confident intervals for women, Barcelona 2001-2016.
| 2001 | 2006 | 2011 | 2016 | |
|---|---|---|---|---|
| Poor self-assessed healtha | ||||
| OSC I | 1 (ref.) | 1 (ref.) | 1 (ref.) | 1 (ref.) |
| OSC II | 1.36 (0.89-0.06) | 1.22 (0.64-2.33) | 0.85 (0.54-1.35) | 1.50 (0.91-2.48) |
| OSC III | 1.62c (1.15-2.30) | 1.76b (1.04-3.00) | 1.26 (0.89-1.78) | 1.80c (1.20-2.68) |
| OSC IV | 2.53d (1.80-3.54) | 2.32c (1.38-3.90) | 1.27 (0.90-1.80) | 2.38d (1.60-3.52) |
| OSC V | 3.04d (2.16-4.28) | 2.83d (1.66-4.82) | 1.48b (1.02-2.14) | 3.35d (2.25-5.00) |
| RII base | 3.16d (2.55-3.91) | 2.93d (2.02-4.25) | 1.66b (1.14-2.40) | 3.92c (2.67-5.76) |
| SII base | 27.38c (22.06-32.69) | 29.34c (18.50-40.18) | 10.70b (2.24-19.16) | 23.65d (15.65-31.64) |
| RII adjusted | 3.06d (2.47-3.8) | 2.66d (1.83-3.88) | 1.44b (1.01-2.06) | 3.40d (2.31-5.00) |
| SII adjusted | 21.37d (16.24-26.50) | 22.46d (12.08-32.84) | 5.16b (0.02-10.31) | 18.47d (10.92-26.02) |
| Poor mental healtha | ||||
| OSC I | 1 (ref.) | 1 (ref.) | 1 (ref.) | 1 (ref.) |
| OSC II | 1.47 (0.99-2.19) | 1.20 (0.61-2.37) | 0.90 (0.54-1.50) | 0.80 (0.46-1.39) |
| OSC III | 1.40 (0.99-1.97 | 1.69 (0.99-2.86) | 1.36 (0.91-2.02) | 1.23 (0.83-1.83) |
| OSC IV | 1.67c (1.20-2.33) | 1.88b (1.13-3.15) | 1.27 (0.85-1.91) | 2.13d (1.48-3.07) |
| OSC V | 2.03d (1.43-2.87) | 2.21c (1.29-3.77) | 1.01 (0.63-1.63) | 2.32d (1.58-3.41) |
| RII base | 1.83d (1.39-2.41) | 2.17d (1.38-3.41) | 1.16 (0.76-1.79) | 3.55d (2.31-5.47) |
| SII base | 9.44d (5.03-13.84) | 15.98c (6.29-25.68) | 2.39 (−4.46-9.25) | 23.78d (14.51-33.06) |
| RII adjusted | 1.77d (1.34-2.35) | 1.97c (1.24-3.12) | 1.03 (0.67-1.59) | 2.94d (1.91-4.52) |
| SII adjusted | 8.13d (3.86-12.39) | 13.77c (3.84-23.70) | 0.73 (−4.67-6.12) | 17.83d (9.35-26.32) |
The use of data from the Barcelona city quinquennial health surveys from 2001 to 2016 revealed persistent absolute and relative inequalities by occupational social class in self-assessed health and mental health outcomes for men and women across years except during the economic crisis in 2011, which showed a drop. Absolute inequalities in mental health widened in the post-crisis period in 2016 in both men and women to values higher than pre-crisis values. Adjustment for employment status reduced absolute inequalities in both sexes but a large share of inequality remains.
Our results suggest that the recurrent inequality was due to faster increases in poor self-assessed health and mental health among persons with lower socioeconomic position after the economic crisis compared to those with a more advantaged socioeconomic position, for whom it declined. This result contrasts with recent findings of a slowdown in declines in poor self-assessed health among people with both low and high socioeconomic position in the countries worst hit by the economic crisis, leaving inequalities unchanged.4 An examination of the Spanish case confirmed previous studies that the economic crisis could have affected more intensely those in lower socioeconomic classes.10,14 The increase in health inequalities recorded in Barcelona in 2016 may be related with labour reforms enacted after the economic crisis. The worsening of the work environment has been pointed as a potential mechanism to the increasing inequalities in health.12,23 The Spanish labour reform of 2012 made layoff cheaper, weakened coverage of collective agreements and increased job insecurity.27 Our analysis that includes a longer term, probably captures better the lasting effect of the relentless crisis than previous research, especially for mental health. Absolute and relative inequalities in mental health for men and women in 2016 widened compared to figures for previous years. These findings are close to the pattern followed by England from 1991 to 2014, when inequalities in mental widened after the recession and during the austerity measures.18 The adverse working conditions, job insecurity, higher unemployment rates and poor prospects for younger people disproportionately affected persons with lower socioeconomic position.28 Indeed, this hypothesis is partially confirmed by the reduction in absolute inequalities in mental health after adjustment for employment situation. Our results differ from some previous research that finds increasing inequalities for men only.20,21,23 In Barcelona, temporary work, part-time work and other precarious working arrangements spread across the work force but affected women more than men.28 However, absolute inequalities in 2016, after adjustment for employment, still remained above mean trends, and consequently a large share in inequalities remains unexplained, with employment situation only partly explaining recent increases in mental health problems.22 Even though it has been alleged that the health system in Spain has managed to avoid irreversible deterioration,29 the magnitude of the social crisis depends on the welfare response to the economic crisis.30 In the case of Barcelona, the trend towards a reduction in health inequalities seems to have been offset by the lasting effects of the economic crisis and the austerity response, reversing any reduction in inequalities and making them persistent or even widening.
An unexpected finding was that, during the economic crisis in 2011, this population showed the largest reduction in inequalities. It has been suggested that the economic crisis offered some social groups the possibility of acquiring healthier habits: more hours of sleep, more physical exercise, less demanding work, more home-made cooking, and more time for leisure.31 Some scholars have stressed the differential effects of the economic crisis on specific social groups, depending on what the dominant mechanism is, a coping response or a stressful one.32 Nonetheless, our results also show an increase in adverse health outcomes during the economic crisis for people with high socioeconomic position. It also has been pointed that the populations with better objective health indicators report worse perceived health, due to an adverse social context, known as the “status inconsistency effect‿, and on the contrary “survivor employees‿ in an adverse work environment may overestimate their living conditions, known as the “other's unemployment effect‿12,32. The lack of a worsening of an adverse health effect amidst the economic crisis may also be due to a delayed effect. It has been emphasised that inequalities have stronger effects on self-assessed health in follow-up analyses with the incorporation of lag effects.33
A strength of our study is that it used robust at the city level and covered a wide time span. It is recommended to report both RII and SII, both measures have the advantage of including the information available from all socioeconomic position. However, changes in the composition of those groups can lead to bias in the interpretation of disparities.34 Our inequality estimates can be conservative because, with increasing precariousness, occupational class may not fully capture emerging sources of inequality such as those engaged in highly temporary jobs, or other adverse working conditions. In this regard, the GHQ is also known to have lower sensitivity to more disadvantaged groups so that underlying inequalities can be underestimated.35
In summary, the lasting effects of the 2008 economic crisis and the austerity programmes imposed since then may have contributed to the persistence of socioeconomic inequalities in self-assessed health and the widening of those for mental health.
Several studies show the persistence of economic inequalities in health outcomes. With some fluctuations during the economic crisis of 2008, socioeconomic inequalities in poor self-assessed health persist or even widens for poor mental health.
What does this study add to the literature?Potential downward trends in poor self-assessed and mental health in pre-crisis period are reverted in post-crisis period. Health inequalities persist even after accounting by employment situation.
What are the implications of the results?Local governments face global threats with limited local competences and financing. The reversion of the austerity response would help to reduce socioeconomic inequalities in health.
Miguel ÿngel Negrín Hernández.
Transparency declarationThe corresponding author on behalf of the other authors guarantee the accuracy, transparency and honesty of the data and information contained in the study, that no relevant information has been omitted and that all discrepancies between authors have been adequately resolved and described.
Authorship contributionsX. Bartoll-Roca designed the study and carried it out. L. Palència and M. Gotsens provided methodological support. C. Borrell contributed in writing and discussing the results. All the authors have contributed corrections and improvements in the writing and final presentation of the study.
FundingNone.
Conflicts of interestNone.


