

The International Classification of Functioning, Disability and Health (ICF) advocates a multifactorial and multifaceted conceptualization of disability. The objective of this study was to ascertain major medical, environmental and personal determinants of severe/extreme disability among the elderly population in Spain. The assessment scheme was consistent with the ICF model of disability.
MethodsNine populations contributed probabilistic or geographically-defined samples following a two-phase screening design. The Mini-Mental State Examination and the 12-item version of the World Health Organization-Disability Assessment Schedule, 2nd ed. (WHO-DAS II), were used as cognitive and disability screening tools, respectively. Positively screened individuals underwent clinical work-up for dementia and were administered the 36-item version of the WHO-DAS II to estimate ICF disability levels. We used logistic regression for the purposes of data combination, adjusted for age and sex in all analyses.
ResultsThe sample was composed of 503 participants aged ≥ 75 years. Alzheimer¿s disease and depression were highly predictive of severe/extreme disability (OR: 17.40, 3.71). Good access to social services was strongly associated with a low level or absence of disability (OR: 0.05 to 0.18). Very difficult access to services and having dementia or another psychiatric disorder were associated with an increase in disability (OR: 66.06). There was also a significant interaction effect between access to services and neurological disorders (OR: 12.74).
ConclusionsDisability is highly prevalent among the Spanish elderly and is influenced by medical, social and personal factors. Disability could potentially be reduced by ensuring access to social services, preventing dementia and stroke, and treating depression.
La Clasificación Internacional del Funcionamiento, la Discapacidad y la Salud (CIF) propone un enfoque multifactorial de la discapacidad. El presente estudio analiza los principales determinantes médicos, ambientales y personales de la discapacidad grave y extrema en población anciana española siguiendo una evaluación congruente con el modelo CIF.
MétodosNueve poblaciones aportaron muestras probabilísticas o definidas geográficamente siguiendo un diseño de cribado. Se usaron el Minimental State Examination y el World Health Organization-Disability Assessment Schedule, 2nd ed. (WHO-DAS II, 12 ítems), como cribados cognitivo y de discapacidad, respectivamente. Se evaluaron la presencia de demencia y los grados de discapacidad de la CIF usando la escala WHO-DAS II (36 ítems) entre los positivos al cribado. Los datos se combinaron usando regresión logística, ajustando por edad y sexo en todos los análisis.
ResultadosParticiparon 503 sujetos de 75 y más años de edad. Los individuos con enfermedad de Alzheimer y/o depresión tenían una mayor probabilidad de presentar discapacidad grave o extrema (OR: 17,40, 3,71). El acceso a los servicios sociales tuvo un efecto protector (OR: 0,05 a 0,18), mientras que el acceso «muy difícil» y la presencia de demencia u otro trastorno psiquiátrico se asociaron a un incremento de la discapacidad (OR: 66,06). Hubo una interacción significativa entre acceso a servicios y diagnóstico neurológico (OR: 12,74).
ConclusionesLa discapacidad es altamente prevalente entre los ancianos españoles y está muy asociada a factores médicos, sociales y personales. La accesibilidad a los servicios sociales, la prevención de la demencia y del infarto cerebral, y el tratamiento de la depresión, pueden reducir la discapacidad entre los ancianos españoles.
The aging population in Spain is growing as a consequence of the low birth rate, increased life expectancy, and the low lethality of chronic diseases.1,2 While disability among the elderly is a major social concern, there is a dearth of epidemiological studies analyzing its potential determinants. Several studies have shown that specific diseases contribute to the disability status of the elderly population. For instance, an epidemiological survey conducted in Mannheim (Germany) reported a 73% prevalence of dementia among dependent elderly people.3 Agüero-Torres et al4 showed that 49% of functional dependence in activities of daily living (ADL) was attributable to a diagnosis of dementia in a residential sample aged above 75 years in Stockholm. Harwood et al5 established that, although ADL dependence was to a greater extent attributable to disease-related factors (dementia, depression), socioeconomic determinants including housing standards, income and social support (emotional and physical comfort provided by family and friends) also contributed significantly. Although these findings are promising, the literature on the topic lacks a multi-faceted evaluation of disability and a more comprehensive analysis of the potential impact of environmental and social factors.
Disability measurement approaches have focused narrowly on ADL or have used composite indices targeting sensory and cognitive disability.6,7 For instance, traditional measures of ADL pay no attention to the various facets of disability that are known to be highly predictive of self-rated health and the need for services, such us the ability to communicate with others and maintain an active social life.8 In contrast, the International Classification of Functioning, Disability and Health (ICF)9 conceptualizes disability as a multifactorial construct incorporating two basic components: changes in body structure and functions, and limitations in activities and participation.
In the ICF scheme, health conditions, environmental and personal factors are all potential determinants of disability. In the present study we aimed to illustrate the implementation of such a multifaceted and multifactorial approach to disability in an epidemiological screening survey.
The goal of the present study was to identify the associations among health conditions, environmental and personal factors with disability levels across the domains of activities and participation of the ICF. The World Health Organization, Disability Assessment Schedule 2nd ed. (WHO-DAS II) and the International Classification of Functioning disability levels were used for assessment and case ascertainment.9,10 This study expands a previous analysis of this project. We initially studied the prevalence of dementia and disability in this population. The present study focuses on factors of disability.11,12
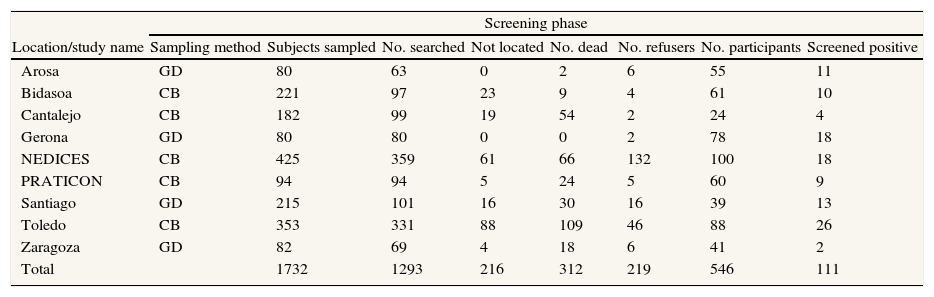
MethodsStudy populationParticipants were recruited from a recent Spanish epidemiological survey on aging conducted in June 2005. The study sample was composed of probabilistic and geographically-defined subsamples. More specifically, we obtained data on the prevalence of chronic geriatric, neurological and mental disorders from the principal investigators of nine studies conducted in Spain. Each location contributed geographically-defined or census-based random samples from the population originally surveyed in their respective studies (age ≥75).13–21 Subsamples were obtained from survivors residing in the following study areas, where the original surveys were conducted: Arosa, Bidasoa, Cantalejo, Gerona, Central Spain (NEDICES), Prat de Llobregat (PRATICON), Santiago de Compostela, Toledo and Zaragoza (fig. 1). Sampling continued until an average of 60 participants per location were recruited. Additional details of the sampling process in each location are provided in table 1. The number of participants to be sampled in each location was estimated by means of the mortality rates for the birth cohorts under study.22 Mortality was proportional to the delay from the original survey, as was the number of participants to be sampled. To avoid selection bias, the groups used their original census-based sampling procedure. In locations with a highly limited number of survivors, a new geographically-defined sample was obtained from selected city neighborhoods. Additional details on the sampling process are shown in table 1. Cohorts consisted of elderly people living at home and in residential care and in rural and urban settings. Significant losses were caused by death and the inability to locate individuals during the sampling process (fig. 2). These circumstances (particularly death) may not cause specific selection biases in a geographically-defined prevalent sample. Dead and non-located individuals (due to death or change of residence outside the geographic area) were not considered as part of the sampling frame. The duration of the follow-up from the prevalence date varied from 3 years for El Prat to 15 years for Gerona. Assessments were conducted in two successive visits to the individual's home. In the first visit, we conducted all health-related assessments. In the second visit, we retrieved all the information pertaining to personal and social factors (see the assessments section).
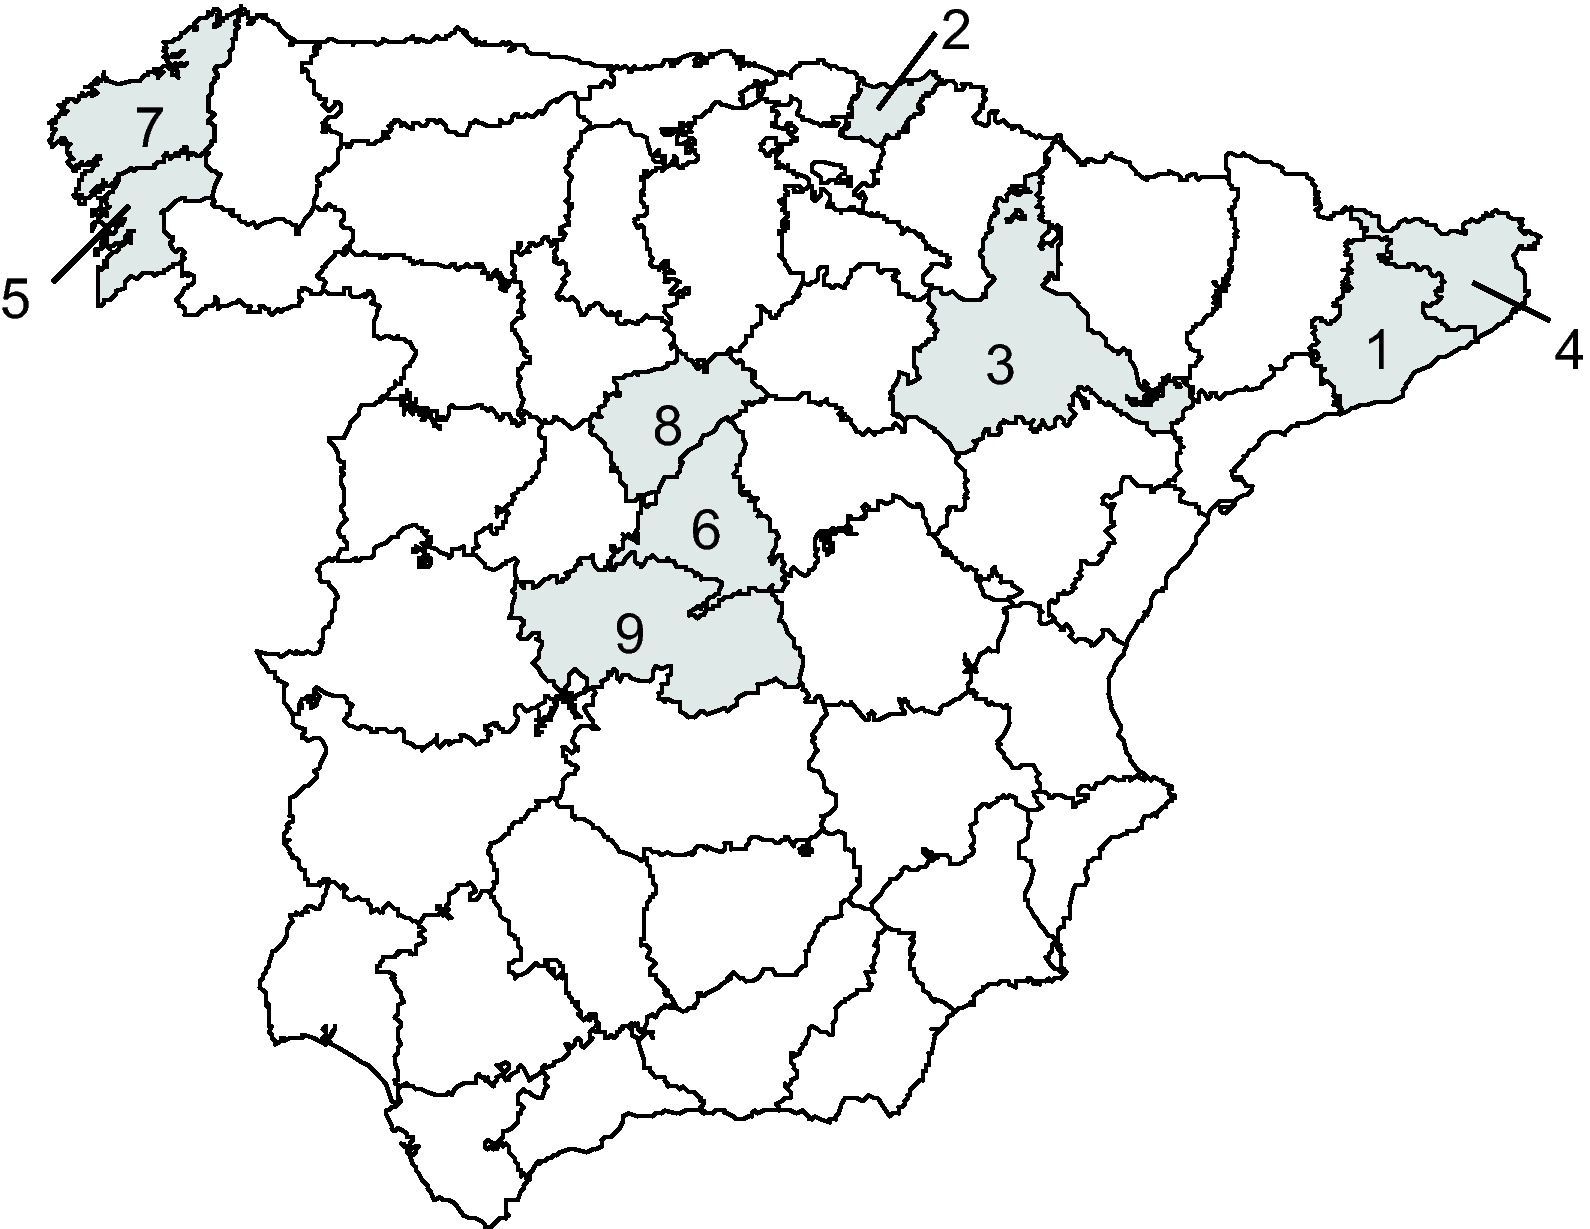
 El Prat de Llobregat (Barcelona), n = 59. 2) Irún-Hondarribia (Guipúzcoa), n = 57. 3) Zaragoza, n = 31. 4) Gerona, n = 75. 5) Isla de Arosa (Pontevedra), n = 53. 6) Getafe (Madrid), n = 98. 7) Santiago de Compostela (La Coruña), n = 33. 8) Cantalejo (Segovia), n = 24. 9) Toledo, n = 73. With permission from Acta Neurologica Scandinavica.")
Geographical location and size of samples comprising the Spanish Epidemiological Survey on Aging. 1) El Prat de Llobregat (Barcelona), n = 59. 2) Irún-Hondarribia (Guipúzcoa), n = 57. 3) Zaragoza, n = 31. 4) Gerona, n = 75. 5) Isla de Arosa (Pontevedra), n = 53. 6) Getafe (Madrid), n = 98. 7) Santiago de Compostela (La Coruña), n = 33. 8) Cantalejo (Segovia), n = 24. 9) Toledo, n = 73. With permission from Acta Neurologica Scandinavica.
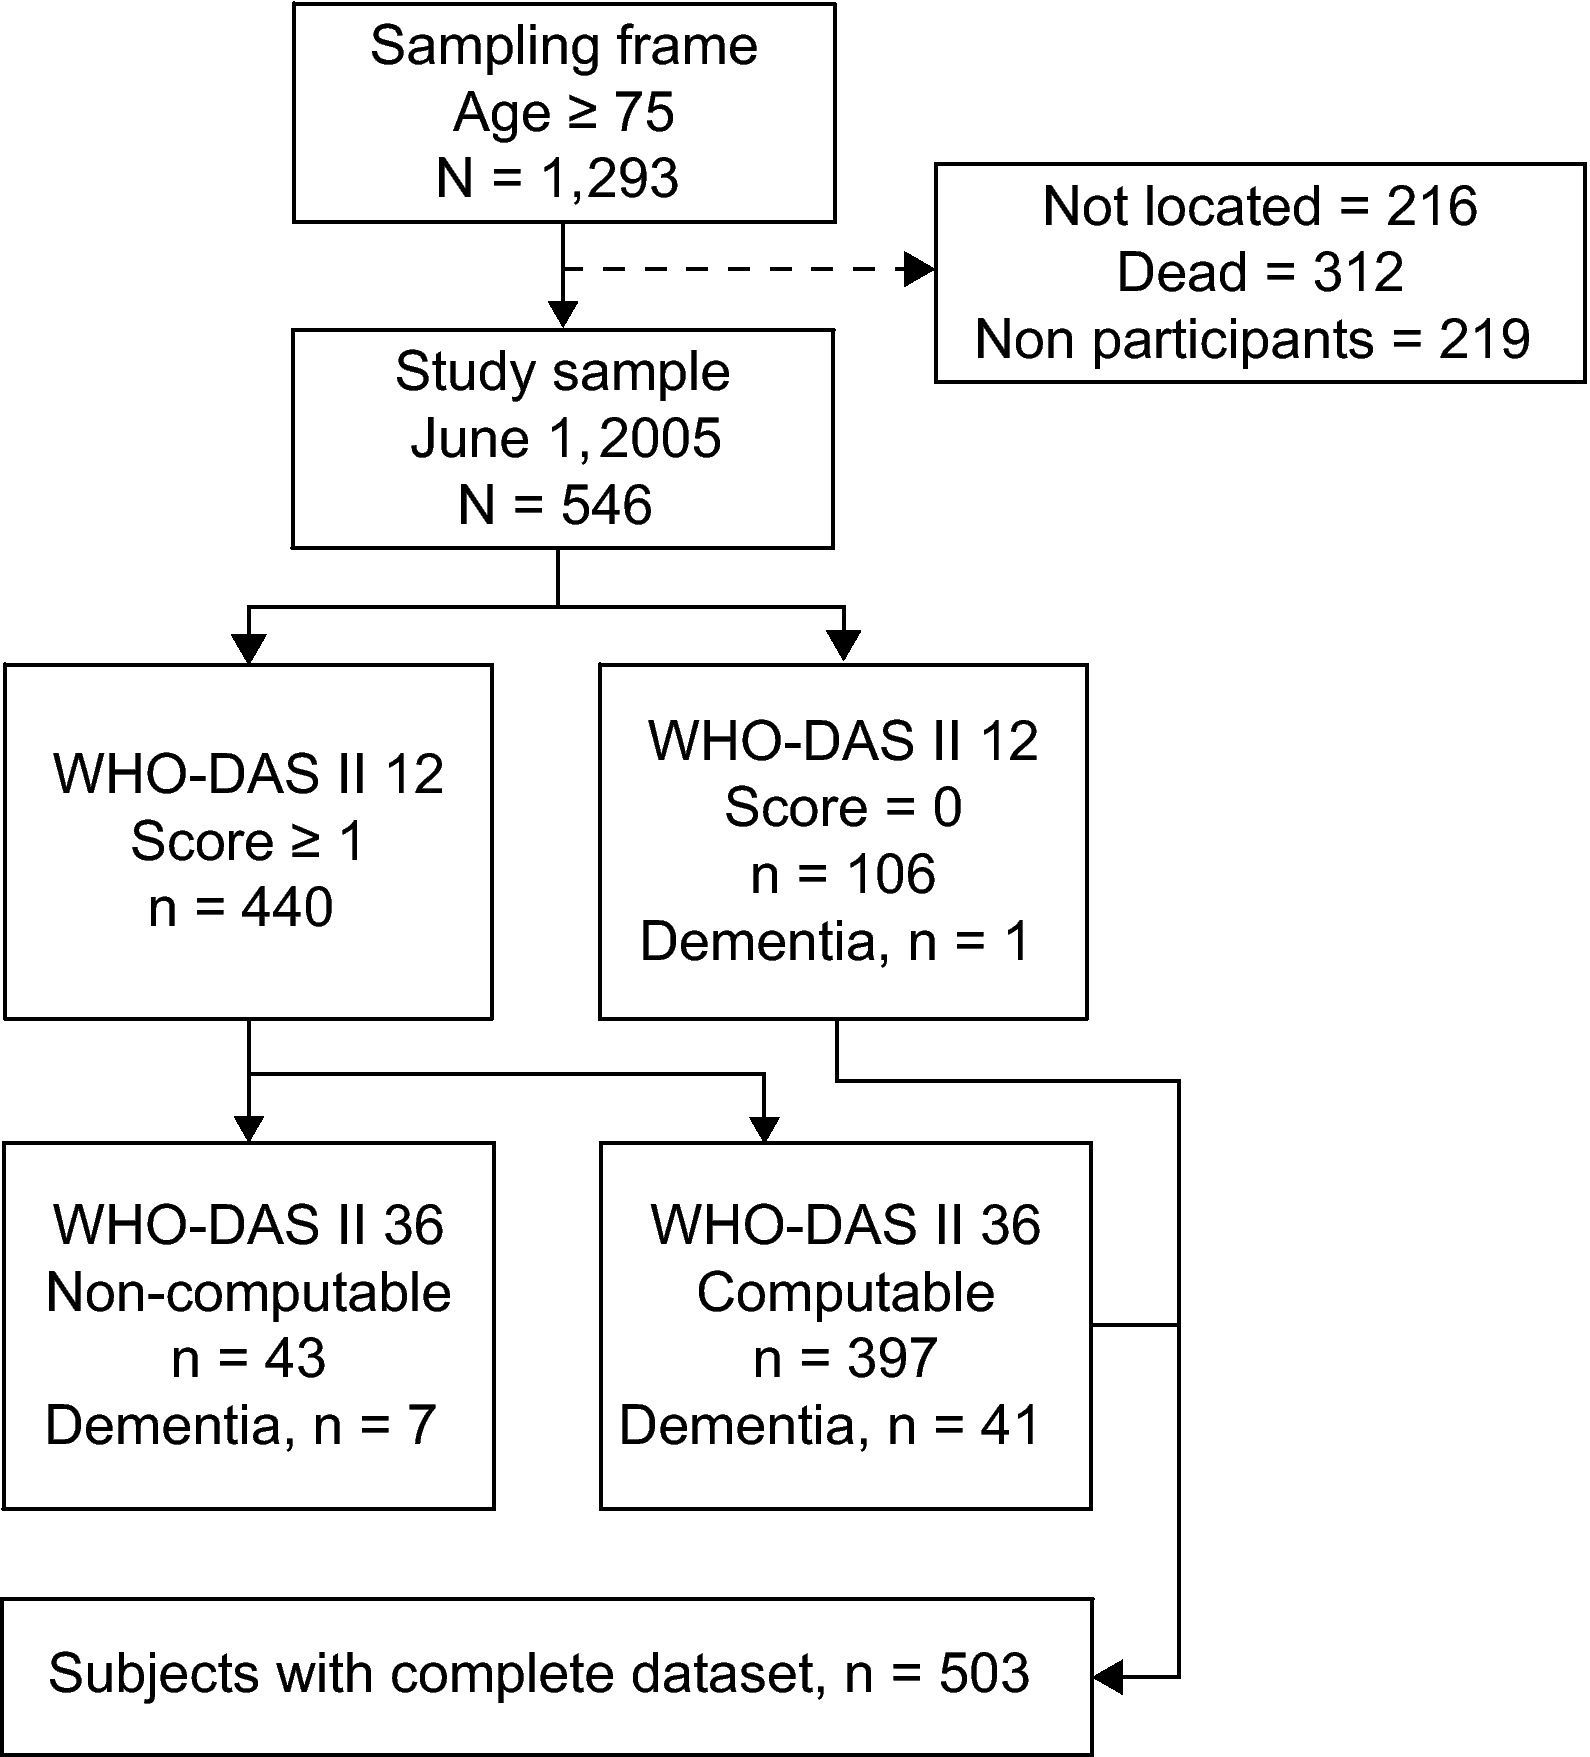
Sample attrition by contributing subsample and results of case ascertainment (modified from Acta Neurologica Scandinavica).
| Screening phase | ||||||||
| Location/study name | Sampling method | Subjects sampled | No. searched | Not located | No. dead | No. refusers | No. participants | Screened positive |
| Arosa | GD | 80 | 63 | 0 | 2 | 6 | 55 | 11 |
| Bidasoa | CB | 221 | 97 | 23 | 9 | 4 | 61 | 10 |
| Cantalejo | CB | 182 | 99 | 19 | 54 | 2 | 24 | 4 |
| Gerona | GD | 80 | 80 | 0 | 0 | 2 | 78 | 18 |
| NEDICES | CB | 425 | 359 | 61 | 66 | 132 | 100 | 18 |
| PRATICON | CB | 94 | 94 | 5 | 24 | 5 | 60 | 9 |
| Santiago | GD | 215 | 101 | 16 | 30 | 16 | 39 | 13 |
| Toledo | CB | 353 | 331 | 88 | 109 | 46 | 88 | 26 |
| Zaragoza | GD | 82 | 69 | 4 | 18 | 6 | 41 | 2 |
| Total | 1732 | 1293 | 216 | 312 | 219 | 546 | 111 | |
CB: census-based random sampling; GD: geographically-defined cohort. No. searched: searched individuals from the sampled subjects until an average of 60 participants per group was reached.

We implemented a two-phase screening survey within a cross-sectional design. The 12-item WHO-DAS II was administered to all eligible participants for screening purposes. Participants scoring above 0 were administered the 36-item WHO-DAS II.
Since dementia is the health condition contributing the most to disability in the elderly23 and is highly underdiagnosed in Spain,24 simultaneous cognitive screening was also administered, using the Spanish version of the Mini-Mental State Examination (MMSE).25,26
The human subjects review board of the Carlos III Health Institute (Madrid, Spain) approved the study protocol. All participants signed a written informed consent document drafted in accordance with the guidelines in the Helsinki Declaration. The participants were visited twice at their home or nursing home. In the first visit, cognitive screening through the Spanish version of the MMSE was administered. Further details on the diagnostic procedure for dementia and the study design are available in a methodological study published as part of the present project11 and in a subsequent study focused solely on the prevalence of disability.12
Assessments- 1)
Mini-Mental State Examination (MMSE)
The MMSE is a standard screening measure of cognitive deterioration and has been validated in the Spanish elderly population25,26 (cut-off: < 24).
- 2)
Disability assessment (WHO-DAS II)
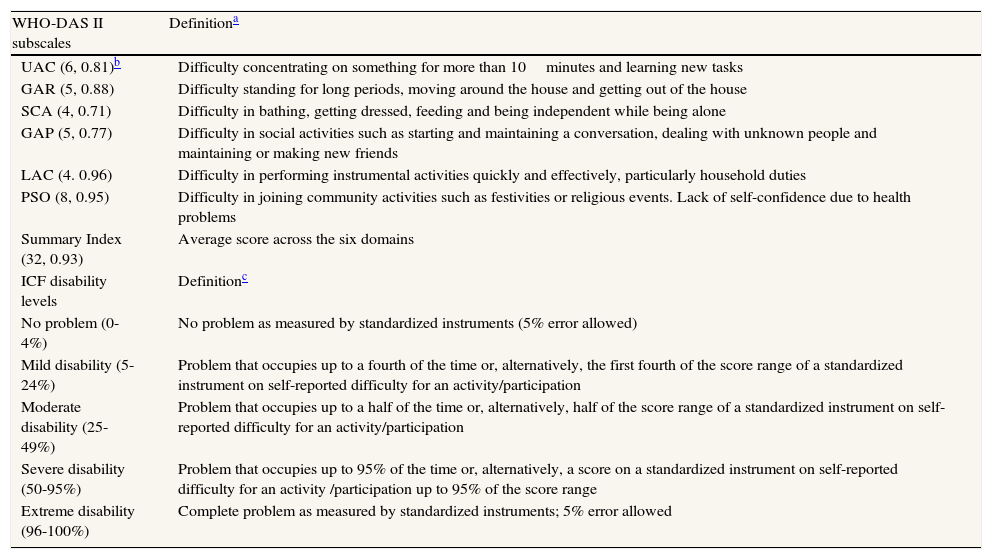
The WHO-DAS II (36-item) is a self-reported scale assessing six disability domains referring to the month preceding administration:10 understanding and communication (UAC), getting around (GAR), self-care (SCA), getting along with people (GAP), life activities (LAC), and participation in society (PSO) (table 2). Each item is scored on a 5-point Likert scale and establishes the difficulty experienced by the respondent in performing a given activity (no problem, mild, moderate, severe, and extreme difficulty).The scale has been translated to Spanish and adapted to the Spanish elderly population27 showing appropriate data quality, acceptability, scale scores and internal consistency (Cronbach's alpha by domain: 0.71-0.96; Cronbach's alpha for the summary index: 0.93). Similar findings were reported in a validation study incorporating a global sample with chronic diseases, which also evaluated responsiveness and latent structure.28 The empirical literature on the WHO-DAS II has been reviewed by Federici et al.29
Table 2.Qualitative definition of WHO-DAS II subscales and ICF disability levels. With permission from BMC Public Health.
WHO-DAS II subscales Definitiona UAC (6, 0.81)b Difficulty concentrating on something for more than 10minutes and learning new tasks GAR (5, 0.88) Difficulty standing for long periods, moving around the house and getting out of the house SCA (4, 0.71) Difficulty in bathing, getting dressed, feeding and being independent while being alone GAP (5, 0.77) Difficulty in social activities such as starting and maintaining a conversation, dealing with unknown people and maintaining or making new friends LAC (4. 0.96) Difficulty in performing instrumental activities quickly and effectively, particularly household duties PSO (8, 0.95) Difficulty in joining community activities such as festivities or religious events. Lack of self-confidence due to health problems Summary Index (32, 0.93) Average score across the six domains ICF disability levels Definitionc No problem (0-4%) No problem as measured by standardized instruments (5% error allowed) Mild disability (5-24%) Problem that occupies up to a fourth of the time or, alternatively, the first fourth of the score range of a standardized instrument on self-reported difficulty for an activity/participation Moderate disability (25-49%) Problem that occupies up to a half of the time or, alternatively, half of the score range of a standardized instrument on self-reported difficulty for an activity/participation Severe disability (50-95%) Problem that occupies up to 95% of the time or, alternatively, a score on a standardized instrument on self-reported difficulty for an activity /participation up to 95% of the score range Extreme disability (96-100%) Complete problem as measured by standardized instruments; 5% error allowed UAC: understanding and communication; GAP: getting along with people; LAC: life activities; GAR: getting around; PSO: participation in society; SCA: self-care. Activity: execution of a task or action by an individual; Participation: involvement in a life situation; Problem: self-reported difficulty/number of days with disability over the last month in actual performance or abstract capacity (no environmental aids) to complete an activity.
Work items were omitted. Life activities items were not computed in participants with no household duties. Finally, we decided not to compute item D4.5 (sexuality) due to the high number of refusals to respond. Missing data per item (criterion ≤ 10%) and fully computable scores were within the standard range of usable values (criterion ≥ 90%).30
Each domain and the complete scale generate a summary index ranging from 1 to 100, with higher scores indicating greater disability. Scale scores were transformed into ICF disability categories before any statistical analyses were conducted: no problem (0%-4%), mild problem (5%-24%), moderate problem (25%-49%), severe problem (50%-95%), and extreme problem (96%-100%).9
- 3)
Health conditions affecting disability
Morbidity was identified by licensed physicians through direct medical examination and perusal of medical records on the basis of a pre-established list of prevalent diseases and health conditions in the elderly (cf. Swedish National Study of Aging and Care in Kungsholmen; www.aldrecentrum.se/snack). These conditions were used as independent variables both individually and grouped under their respective International Classification of Diseases, 10th Revision (ICD-10) chapter: circulatory system (angina pectoris, arrhythmia, myocardial infarction, heart failure, hypertension, other), respiratory system (asthma, chronic obstructive pulmonary disease, other), infectious diseases (meningitis, poliomyelitis, tuberculosis, Lyme disease, other), nervous system (epilepsy, Parkinson's disease, other), musculoskeletal and injuries of external cause (arthritis, arthrosis, osteoporosis, polymyalgia rheumatica, renal failure, bone fracture, vertebral lesion), skin and subcutaneous tissue (lupus, vasculitis, other), endocrine system (diabetes type I and II, hyperthyroidism, hypothyroidism, other), eye (cataract, glaucoma, age-related macular degeneration, other), neoplasm, and mental and behavioral disorders (depression, psychosis, dementia, psychological distress, developmental disabilities, other). Smoking was grouped with respiratory diseases. Cerebrovascular disease, brain damage and head trauma were grouped with neurological diseases. Morbidity was defined as the total number of identified conditions. Since very few participants had more than one condition in a given category (e.g., neurological), disease groupings were computed as binary variables when used as independent variables in logistic regression analyses (0, no condition; 1, one or more conditions in that category).
Given the strong impact of depression on disability,31,32 the presence of depressive symptoms was assessed formally using the EURO-D scale.33,34 In addition, depression was assessed clinically by the licensed physician conducting the health survey (gerontologist, neurologist or psychiatrist).
- 4)
Personal, and environmental factors
In keeping with the ICF framework, personal and environmental factors were also assessed: (i) educational level: illiterate, primary incomplete, primary, and higher than primary; (ii) self-reported socioeconomic status over a 5-point scale (1: very low; 5: very high); (iii) frequency of social contacts, measured by the median of self-reported frequency of telephone and in-person contacts with children, extended family and friends (daily, weekly, bi-weekly, monthly, never); (iv) availability of a confidant, specifically, the self-reported presence of someone with whom the individual could share emotional experiences and life concerns (confidants were considered a form of social support); (v) availability of social and health resources, measured by the median of accessibility to the following six social and health resources on a 5-point scale (1: very accessible; 5: very hard to access): primary-care center/medical attention, public transportation, public leisure resources (garden, park), shops, social clubs/cultural resources, and religious services; (vi) municipality size: rural: 1–10,000 inhabitants; urban: > 10,000 inhabitants (source: Spanish National Institute of Statistics, 2007).
Binary logistic regression was used to identify disability-related factors, including health conditions (either grouped or as specific diagnoses) and personal and environmental variables. We defined the outcome variable of interest on the basis of the ICF level of disability: participants with severe or extreme disability levels, and participants with no disability, low, or moderate disability. This dichotomy divided the distribution of participants in two equally sized groups, thus maximizing statistical power. In addition, several preliminary trials using ordinal logistic regression failed to generate proportional odds across the levels of the outcome variable. Odds ratios (OR) and 95% confidence intervals (95%CI) were computed, controlling for age (continuous variable) and sex in all models. In addition, when examining personal and social factors, we also controlled for education, depression (EURO-D score), cognitive function (MMSE score), and morbidity.
The significance of sets of multiple independent variables was evaluated with the Wald χ2 tests, using design-adjusted, multiply-imputed coefficient variance–covariance matrices. Interaction effects among strong independent variables were analyzed to support the identification of specific groups of individuals that were more likely to be disabled. While we could have used several rank-ordered definitions of cases (e.g., mild, severe disability) to implement ordinal regression analyses, failure to meet proportional odds assumptions prevented this analytical strategy.
Our analytical strategy was guided by the ICF framework. Therefore, we developed two separate sets of models based on logistic regression analysis. These two sets of models explored the three groups of disability factors that are prominent in the ICF, namely health conditions, personal factors, and environmental factors of disability. The first set of models examined health factors across disability domains using groups of clinical diagnoses as putative indicators for health conditions. These models were subsequently replicated with specific prevailing diagnoses as independent variables; only prevalent conditions were used as independent variables. A second model incorporated independent variables of disability based on personal and environmental factors (e.g., educational level, access to social and health resources in the community). Both models were replicated across WHO-DAS II disability domains. The ICF model allows for complex interactions among disability factors. Therefore, we conducted additional logistic regression analyses incorporating health conditions, environmental and personal factors (including interaction factors between them) identified in the models initially obtained. With this strategy we aimed to identify specific subgroups that were more likely to be disabled.
We entered all variables in the model in a single step without checking for significant effects a priori. Categories of clinical diagnoses were grouped according to the ICD-10 classification. Comorbidity in each group was added as an independent variable. Specific health conditions used as independent variables in the subsequent model were selected based on the number of participants with the condition (20 or more). In the case of personal and environmental factors, we selected a set of independent variables that are known predictors for numerous health outcomes (education, social status, social contacts, municipality size, etc.). Finally, as indicated above, the examination of interaction effects was based on the performance of the selected variables in the initial model. Factors that were significantly associated with disability in single factor analyses were subsequently selected to study interaction. We examined the interaction of specific health conditions with environmental and personal factors in order to support the view that health conditions can act jointly with environmental and personal factors and affect disability. Interaction analyses were aimed at identifying groups of individuals that were particularly disabled. Factors that were significantly associated with disability in single factor analyses were subsequently selected to study interaction. First-degree interaction factors were checked in subsequent models. Finally, we entered all variables deemed relevant in the model providing results in a single step. Otherwise, priority was given to interaction factors and reclassification in broader exposure categories.
Etiological fractions and 95%CI for independent variables showing the highest contribution to prevalent disability status were calculated as:
where ne is the number of the exposed disability cases, and n is the total number of disability cases.35 All analyses in the study were conducted with STATA v. 9 (College Station, Texas). A 0.05 level of significance was used throughout.Results
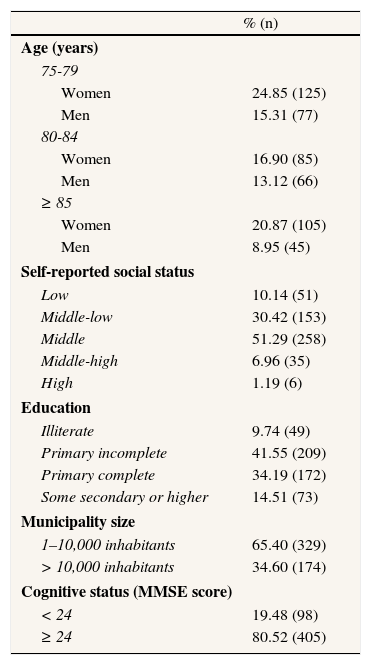
The final sample was composed of 546 participants of which 440 were positive to the disability screening and 106 were negative. Of this total, 503 had complete datasets including a WHO-DAS II (36 items) for positively screened participants (mean age: 82.0, SD: 4.8; 62.6% women; range 75-96). A summary description of the participants’ sociodemographic characteristics is provided in table 3. Most participants were of rural origin. Participants (n = 503) and non-participants (n = 43) did not differ in sex, age, rural/urban origin, or location of recruitment. There was, however, a higher concentration of individuals with dementia among those with non-computable WHO-DAS II (7 out of 43 vs. 42 out of 503).
Characteristics of study participants (n = 503) (with permission from BMC Public Health).
| % (n) | |
| Age (years) | |
| 75-79 | |
| Women | 24.85 (125) |
| Men | 15.31 (77) |
| 80-84 | |
| Women | 16.90 (85) |
| Men | 13.12 (66) |
| ≥ 85 | |
| Women | 20.87 (105) |
| Men | 8.95 (45) |
| Self-reported social status | |
| Low | 10.14 (51) |
| Middle-low | 30.42 (153) |
| Middle | 51.29 (258) |
| Middle-high | 6.96 (35) |
| High | 1.19 (6) |
| Education | |
| Illiterate | 9.74 (49) |
| Primary incomplete | 41.55 (209) |
| Primary complete | 34.19 (172) |
| Some secondary or higher | 14.51 (73) |
| Municipality size | |
| 1–10,000 inhabitants | 65.40 (329) |
| > 10,000 inhabitants | 34.60 (174) |
| Cognitive status (MMSE score) | |
| < 24 | 19.48 (98) |
| ≥ 24 | 80.52 (405) |
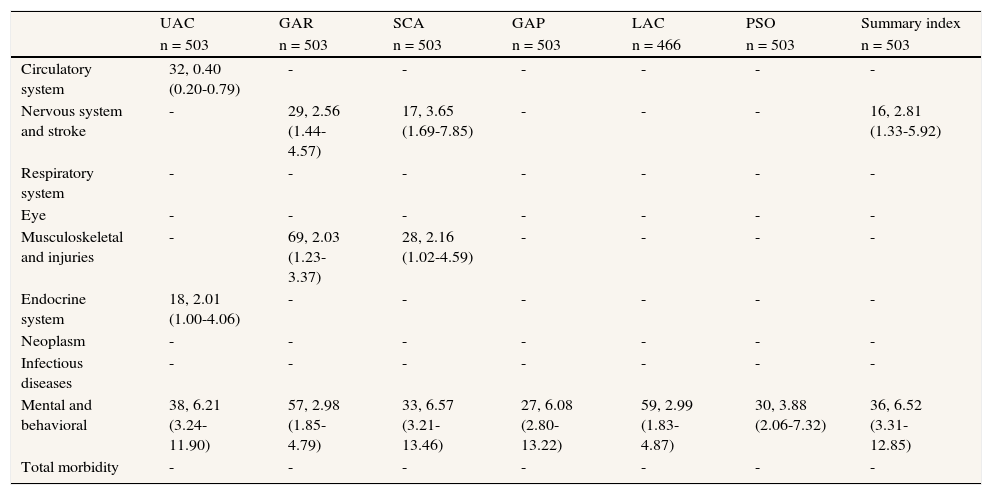
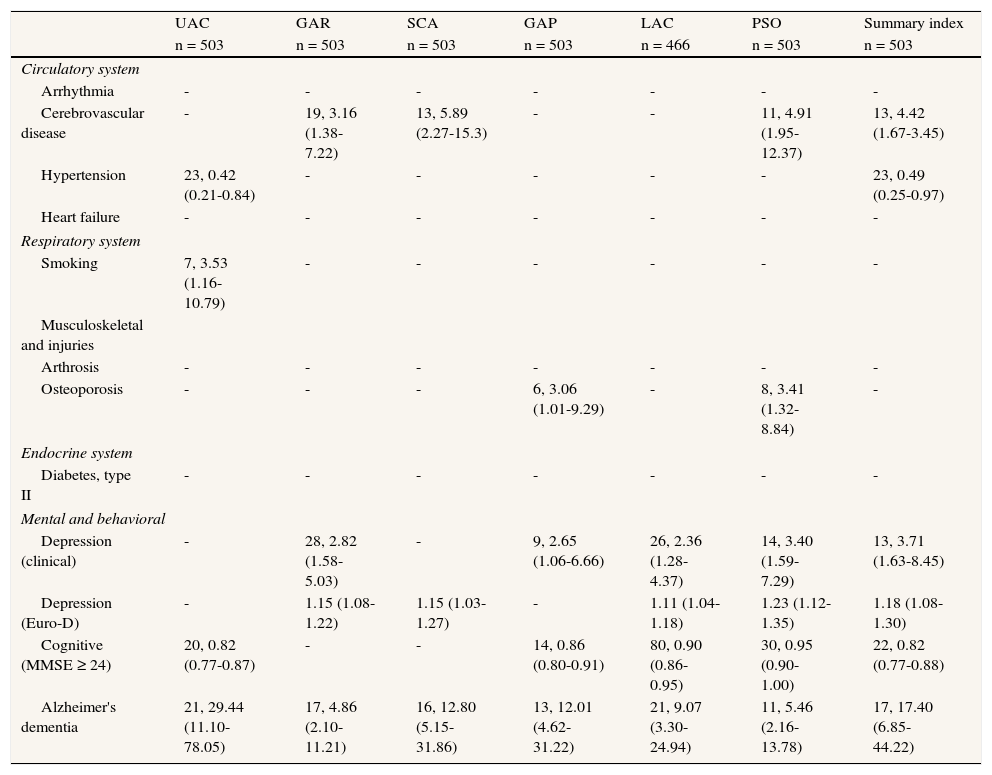
For grouped conditions, only mental and behavioral (OR: 6.52; 95%CI: 3.31-12.85, number of individuals with a psychiatric disorder and severe/extreme disability [hereinafter n] = 146), and neurological disorders, including cerebrovascular disease (OR: 2.81; 95%CI: 1.33-5.92, n = 85), were significantly associated with severe/extreme disability (table 4). Notably, the category of mental and behavioral disorders was the only independent variable significantly associated with all domains of disability. With more specific conditions, cerebrovascular disease was a significant independent variable of disability status for GAR, SCA, PSO (OR range: 3.16 to 4.91, n = 49) and for disability status based on the WHO-DAS II summary index (OR: 4.42; 95%CI: 1.67-3.45; table 5). Among mental and behavioral disorders, diagnoses of depression and Alzheimer's disease were strongly associated with severe/extreme disability. A clinical diagnosis of depression was significant for the GAR, GAP, LAC and PSO domains (OR range: 2.36 to 3.40, n = 74). The presence of depressive symptoms (EURO-D) was significantly associated with GAR, SCA, LAC and PSO (OR range: 1.11 to 1.23, n [EURO-D > 0] = 249) and the WHO-DAS II summary index (OR: 1.18; 95%CI: 1.08-1.30). Alzheimer's disease proved to have the strongest effect across all disability domains (OR range: 4.86 to 29.44, n = 41), as well as for disability status based on the WHO-DAS II summary index (OR: 17.40; 95%CI: 6.85-44.22). Normal cognitive functioning established by the MMSE ≥ 24 was associated with a low level of disability in UAC, SCA, GAP and LAC (OR range: 0.82 to 0.90, n = 405) and the WHO-DAS II summary index (OR: 0.82; 95%CI: 0.77-0.88).
Likelihood of disability by ICD disease category (number of participants with the condition, OR [95%CI]).
| UAC | GAR | SCA | GAP | LAC | PSO | Summary index | |
| n = 503 | n = 503 | n = 503 | n = 503 | n = 466 | n = 503 | n = 503 | |
| Circulatory system | 32, 0.40 (0.20-0.79) | - | - | - | - | - | - |
| Nervous system and stroke | - | 29, 2.56 (1.44-4.57) | 17, 3.65 (1.69-7.85) | - | - | - | 16, 2.81 (1.33-5.92) |
| Respiratory system | - | - | - | - | - | - | - |
| Eye | - | - | - | - | - | - | - |
| Musculoskeletal and injuries | - | 69, 2.03 (1.23-3.37) | 28, 2.16 (1.02-4.59) | - | - | - | - |
| Endocrine system | 18, 2.01 (1.00-4.06) | - | - | - | - | - | - |
| Neoplasm | - | - | - | - | - | - | - |
| Infectious diseases | - | - | - | - | - | - | - |
| Mental and behavioral | 38, 6.21 (3.24-11.90) | 57, 2.98 (1.85-4.79) | 33, 6.57 (3.21-13.46) | 27, 6.08 (2.80-13.22) | 59, 2.99 (1.83-4.87) | 30, 3.88 (2.06-7.32) | 36, 6.52 (3.31-12.85) |
| Total morbidity | - | - | - | - | - | - | - |
Reference category in parenthesis. Outcome variable, 0 = no disability, mild or moderate disability, 1 = individuals with severe or extreme disability (according to ICF severity ranges and WHO-DAS II scores). All models included age (continuous) and sex. Non-significant associations not reported. LAC omitted for individuals with no household duties assigned (n = 37).
UAC = understanding and communication; GAP = getting along with people; GAR = getting around; LAC = life activities; PSO = participation in society; SCA = self-care.
Likelihood of disability by specific disease or health condition (number of participants with the condition, OR [95%CI]).
| UAC | GAR | SCA | GAP | LAC | PSO | Summary index | |
| n = 503 | n = 503 | n = 503 | n = 503 | n = 466 | n = 503 | n = 503 | |
| Circulatory system | |||||||
| Arrhythmia | - | - | - | - | - | - | - |
| Cerebrovascular disease | - | 19, 3.16 (1.38-7.22) | 13, 5.89 (2.27-15.3) | - | - | 11, 4.91 (1.95-12.37) | 13, 4.42 (1.67-3.45) |
| Hypertension | 23, 0.42 (0.21-0.84) | - | - | - | - | - | 23, 0.49 (0.25-0.97) |
| Heart failure | - | - | - | - | - | - | - |
| Respiratory system | |||||||
| Smoking | 7, 3.53 (1.16-10.79) | - | - | - | - | - | - |
| Musculoskeletal and injuries | |||||||
| Arthrosis | - | - | - | - | - | - | - |
| Osteoporosis | - | - | - | 6, 3.06 (1.01-9.29) | - | 8, 3.41 (1.32-8.84) | - |
| Endocrine system | |||||||
| Diabetes, type II | - | - | - | - | - | - | - |
| Mental and behavioral | |||||||
| Depression (clinical) | - | 28, 2.82 (1.58-5.03) | - | 9, 2.65 (1.06-6.66) | 26, 2.36 (1.28-4.37) | 14, 3.40 (1.59-7.29) | 13, 3.71 (1.63-8.45) |
| Depression (Euro-D) | - | 1.15 (1.08-1.22) | 1.15 (1.03-1.27) | - | 1.11 (1.04-1.18) | 1.23 (1.12-1.35) | 1.18 (1.08-1.30) |
| Cognitive (MMSE ≥ 24) | 20, 0.82 (0.77-0.87) | - | - | 14, 0.86 (0.80-0.91) | 80, 0.90 (0.86-0.95) | 30, 0.95 (0.90-1.00) | 22, 0.82 (0.77-0.88) |
| Alzheimer's dementia | 21, 29.44 (11.10-78.05) | 17, 4.86 (2.10-11.21) | 16, 12.80 (5.15-31.86) | 13, 12.01 (4.62-31.22) | 21, 9.07 (3.30-24.94) | 11, 5.46 (2.16-13.78) | 17, 17.40 (6.85-44.22) |
Reference category in parenthesis. Outcome variable, 0 = no disability, mild or moderate disability, 1 = individuals with severe or extreme disability (according to ICF severity ranges and WHO-DAS II scores). All models included age (continuous) and sex. Conditions with less than 20 cases were excluded from the analyses. Non-significant associations not reported. LAC omitted for individuals with no household duties assigned (n = 37).
UAC = understanding and communication; GAP = getting along with people; GAR = getting around; LAC = life activities; PSO = participation in society; SCA = self-care.
Osteoporosis acted as a disability factor but was significant only for the GAP (OR: 3.06; 95%CI: 1.01-9.29, n = 31) and PSO domains (OR: 3.41; 95%CI: 1.32-8.84). A diagnosis of hypertension was associated with low disability but was only significant for UAC (OR: 0.42; 95%CI: 0.21-0.84, n = 268) and the WHO-DAS II summary index (OR: 0.49; 95%CI: 0.25-0.97). Smoking was strongly associated with UAC disability (OR: 3.53; 95%CI: 1.16-10.79, n = 54) (table 3).
Etiological prevalence fractions indicated that mental (psychiatric conditions and dementia) and neurological disorders (major ICD categories) accounted for 59.76% (95%CI: 49.26-65.09) and 20.21% (95%CI: 7.78-26.07) of severe/extreme disability status, respectively. The specific conditions making the highest contribution to disability status were Alzheimer's disease and depression, with etiological fractions of 31.42% (95%CI: 28.47-59.76) and 18.62% (95%CI: 9.85-20.21), respectively.
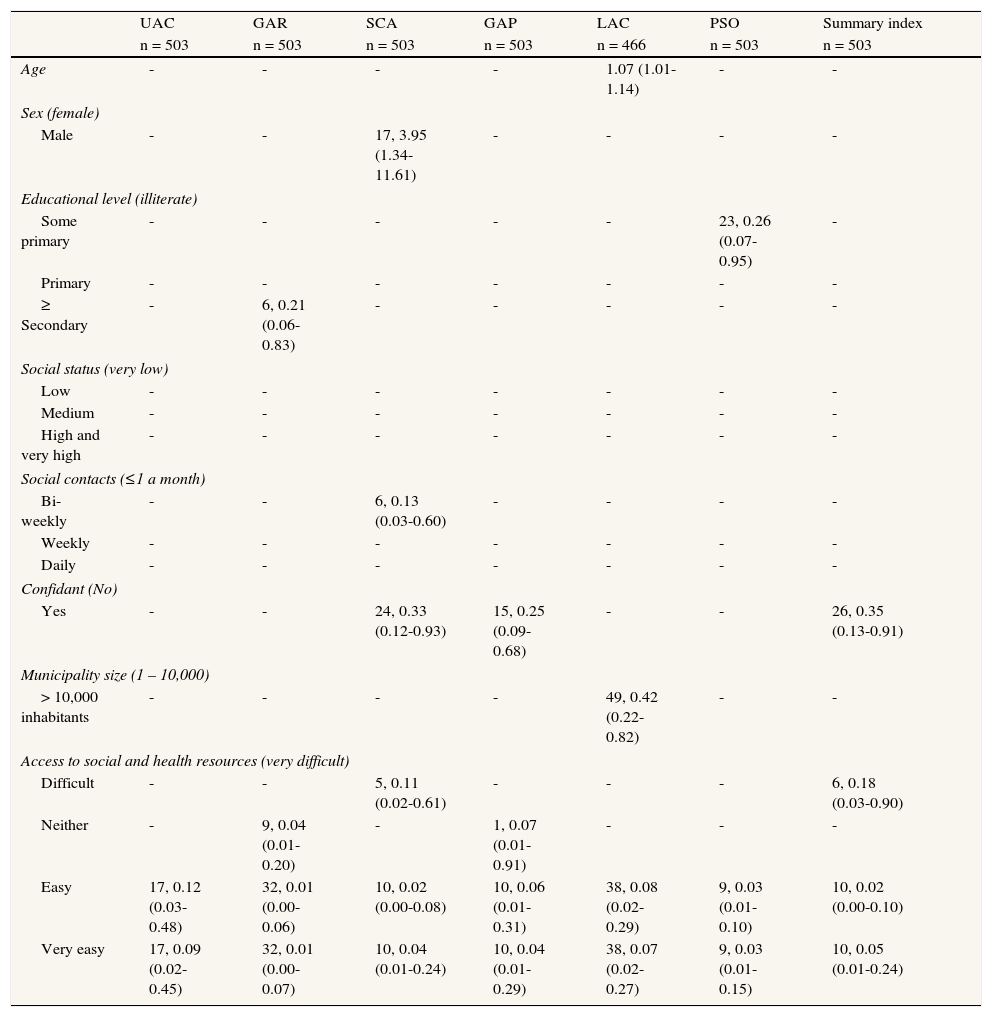
Personal, social and environmental factorsEducational level was negatively associated with disability in the GAR and PSO domains (OR range: 0.21 to 0.26, n [illiterate] = 49, n [some secondary or higher] = 73). Frequent social contacts were associated with no/low disability in the SCA and GAP disability domains (OR range: 0.13 to 0.20, n [≤1 a month] = 105, n [daily] = 127). The availability of a confidant was associated with low disability, not only for SCA and GAP (OR range: 0.25 to 0.33, n = 405), but also for disability status based on the WHO-DAS II summary index (OR: 0.35; 95%CI: 0.13-0.91) (table 4).
Accessibility to social and health resources, and municipality size were associated with low disability. The effect of living in a municipality of 10,000 or more inhabitants was significant for the GAP disability domain (OR: 0.42; 95%CI: 0.22-0.82, n [>10,000 inhabitants] = 329). Accessibility to social and health resources was strongly associated with low disability in all domains. The effect showed some signs of being dose-dependent for all disability domains (difficult access, OR: 0.11-0.89; neither easy nor difficult, OR: 0.04-0.89; easy access, OR: 0.01-0.12; very easy access, OR: 0.01-0.09, n [very difficult] = 36, n [very easy] = 162) and the WHO-DAS II summary index (difficult access, OR: 0.18, 95%CI: 0.03-0.90; neither easy nor difficult, OR: 0.19, 95%CI: 0.03-1.07; easy access, OR: 0.02, 95%CI: 0.00-0.10; very easy access, OR: 0.05, 95%CI: 0.01-0.24). The effect was highly significant across all disability domains but was particularly so for GAR and PSO (table 6).
Likelihood of disability by personal, social and environmental factors (number of participants with the condition, OR [95%CI]).
| UAC | GAR | SCA | GAP | LAC | PSO | Summary index | ||
| n = 503 | n = 503 | n = 503 | n = 503 | n = 466 | n = 503 | n = 503 | ||
| Age | - | - | - | - | 1.07 (1.01-1.14) | - | - | |
| Sex (female) | ||||||||
| Male | - | - | 17, 3.95 (1.34-11.61) | - | - | - | - | |
| Educational level (illiterate) | ||||||||
| Some primary | - | - | - | - | - | 23, 0.26 (0.07-0.95) | - | |
| Primary | - | - | - | - | - | - | - | |
| ≥ Secondary | - | 6, 0.21 (0.06-0.83) | - | - | - | - | - | |
| Social status (very low) | ||||||||
| Low | - | - | - | - | - | - | - | |
| Medium | - | - | - | - | - | - | - | |
| High and very high | - | - | - | - | - | - | - | |
| Social contacts (≤1 a month) | ||||||||
| Bi-weekly | - | - | 6, 0.13 (0.03-0.60) | - | - | - | - | |
| Weekly | - | - | - | - | - | - | - | |
| Daily | - | - | - | - | - | - | - | |
| Confidant (No) | ||||||||
| Yes | - | - | 24, 0.33 (0.12-0.93) | 15, 0.25 (0.09-0.68) | - | - | 26, 0.35 (0.13-0.91) | |
| Municipality size (1 – 10,000) | ||||||||
| > 10,000 inhabitants | - | - | - | - | 49, 0.42 (0.22-0.82) | - | - | |
| Access to social and health resources (very difficult) | ||||||||
| Difficult | - | - | 5, 0.11 (0.02-0.61) | - | - | - | 6, 0.18 (0.03-0.90) | |
| Neither | - | 9, 0.04 (0.01-0.20) | - | 1, 0.07 (0.01-0.91) | - | - | - | |
| Easy | 17, 0.12 (0.03-0.48) | 32, 0.01 (0.00-0.06) | 10, 0.02 (0.00-0.08) | 10, 0.06 (0.01-0.31) | 38, 0.08 (0.02-0.29) | 9, 0.03 (0.01-0.10) | 10, 0.02 (0.00-0.10) | |
| Very easy | 17, 0.09 (0.02-0.45) | 32, 0.01 (0.00-0.07) | 10, 0.04 (0.01-0.24) | 10, 0.04 (0.01-0.29) | 38, 0.07 (0.02-0.27) | 9, 0.03 (0.01-0.15) | 10, 0.05 (0.01-0.24) | |
Reference category in parenthesis. Outcome variable, 0 = no disability, mild or moderate disability, 1 = individuals with severe or extreme disability (according to ICF severity ranges and WHO-DAS II scores). All models included age, sex, morbidity, depression (EURO-D), and cognitive status (MMSE). Non-significant associations not reported. LAC omitted for individuals with no household duties assigned (n = 37).
UAC = understanding and communication; GAP = getting along with people; GAR = getting around; LAC = life activities; PSO = participation in society; SCA = self-care.
Additional binary logistic regression models were computed to analyze the potential interaction among major disease-related and environmental factors of disability. Specifically, the interaction among the presence of neurological disorders and accessibility to health and social resources, and the presence of mental disorders and accessibility to health and social resources was analyzed independently. For the purposes of this analysis, service accessibility was transformed into a binary variable (1: very difficult access; 0: not very difficult access). The interaction between very difficult access to services and having dementia or other psychiatric disorders was highly significant (OR: 66.06; 95%CI: 21.20-205.78, individuals with both characteristics = 19, reference, double negative individuals). In addition, there was also significant access to services by neurological disorder interaction effect (OR: 12.74, 95%CI: 2.78-58.64, n = 4). In terms of etiological fractions, these interactions accounted for 36.69% (95%CI: 35.50-37.07) and 7.23% (95%CI: 5.02-7.71) of severe-extreme disability status, respectively.
DiscussionThe present study illustrates how the ICF disability framework can be transferred into applied epidemiological research. Body functions and environmental and personal factors were assessed in a composite prevalent sample of geographically-defined and population-based elders living in Spain. In keeping with the ICF conceptual model of disability, these assessments were analyzed as determinants of disability, while a multifaceted evaluation of activities and participation one of the key components of disability according to the ICF model– provided the outcome variables for this study.
Our results portray a novel view of disability and dependence among elderly people in Spain. The single factors with the strongest influence on severe/extreme disability status were depression and Alzheimer's disease. Additionally, selected environmental factors, such as rural residence and access to social and health resources, and selected personal factors, such as education and social support (social contacts and the availability of a confidant), were strongly associated with disability status in specific domains. An interpretation of the results will inevitably be mediated by prevalence bias, for instance due to survival selection, and by the structure of the composite population (see below for details).
Our study has several shortcomings. First, clinical diagnosis of conditions other than dementia and depression was based on clinical evaluation and examination of medical records. Although unlikely to bias the associations found, this approach might have underreported the prevalence of any condition that was not previously diagnosed or documented. Second, dementia in participants with non-computable disability assessments may have underestimated the prevalence of dementia. According to our data, seven out of 48 individuals with dementia had non-computable WHO-DAS II scores; these participants tended to have poorer cognitive functioning and therefore would have been likely to lower the disability score of the overall sample. Third, caution should be used when interpreting etiological fractions in a cross-sectional study based on prevalent cases, as the incidences of individuals that were exposed to the putative independent variable before the onset of the outcome status (disability) are not known. In addition, the etiological fraction could be influenced by some factors, such as depression, being the consequence of disability and not its cause. Moreover, some etiological factors of disability were not taken into account (e.g., hearing impairment). Finally, specific associations in our analysis, such as disability and self-reported accessibility to services, might be determined by bi-directional causal loops hampering interpretation of the results. However, accessibility to services is not a purely subjective dimension; most individuals reporting poor access to services were found in rural areas with a population below 10,000 inhabitants as opposed to urban dwellers (27.0% vs. 4.0%).
A high prevalence of chronic diseases in rural areas may have mediated the association between rural living, access to social and health resources, and disability. There is evidence of a higher prevalence of arthritis, diabetes and other disabling chronic diseases in the rural population.36,37 However, none of these conditions alone was found to be a major predictor of disability in our study. While major factors of disability (depression and dementia) were screened for and evaluated systematically, all other diagnoses were established clinically prior to the study (based on perusal of clinical records and personal interview only), and therefore the accuracy of these diagnosed negatives is suboptimal.
The analysis of interaction effects between major social factors of disability (accessibility to social and health resources) and major health conditions (psychiatric or neurological diagnoses) pointed to a small group of highly disabled participants diagnosed with dementia or other psychiatric disorders and with very poor access to care and services. Most of these individuals were women (14 out of 19), lived in rural areas (13 out of 19), were 85 years old or older (15 out of 19) and had dementia (13 out of 19). Importantly, research assistants resorted to third-party informants when assessing highly disabled participants, and the proxies’ reports may have been biased as a consequence of family burden and other factors.38 Nevertheless, the full magnitude of this finding is unlikely to be explained by proxy bias.
A mediating role for social support in the depression-disability dynamic has been proposed.39,40 However, our data provide evidence consistent with an independent effect of depression, as well as of the frequency of social contact and availability of a confidant, on disability status. While having a confidant and frequent social contacts were associated with low disability overall, this effect was particularly significant for the SCA and GAP domains. These domains assess specific social skills (“ability to be alone”, “ability to get along with others”); therefore, both predictive and outcome variables may be targeting different aspects of a wider social functioning construct.
Any interpretations of our results in terms of risk for new disability (i.e., incidence) may be subject to survival bias. In particular, a low level of lethality of chronic diseases would suggest an increased risk for those chronic conditions. Higher mortality among disabled individuals may cause spurious associations and dissipate known risk factors. For instance, the association of hypertension with disability may be mediated by the increased survival of treated hypertension patients. This hypothesis is consistent with the protective effect of hypertension on UAC (i.e., cognitive functioning), which has been reported in studies on cognitive functioning and hypertension treatment.41 Differences in structure by age, rural/urban structure and other factors affecting disability between the composite and the Spanish population aged ≥75 years may undermine the external validity of some of the results, particularly the magnitude of etiologic fractions.
In summary, the most influential factors on disability status in our sample were Alzheimer's disease and depression and, in terms of ICD chapters, neurological and psychiatric diseases. The strongest environmental factor of disability was difficult access to social and health resources in the community. Accessibility interacted with health conditions generating disability (viz. dementia and depression) and with municipality size. Our findings help to identify potential intervention targets to alleviate disability in rural populations, consisting of (i) modifying environmental factors through improved access to services, (ii) improving social support, and (ii) preventing dementia and stroke, and detecting and treating depression.
The International Classification of Functioning advocates a multifactorial and multifaceted model of disability, which is starting to be used in epidemiological research. While medical factors of disability have been extensively studied in case series, environmental and personal factors have been little explored.
What does this study add?An assessment strategy consistent with the International Classification of Functioning can be successfully implemented in a multi-site sample of Spanish elderly. Difficult access to social and health resources in the community is a strong environmental factor of disability and interacts with known causes of disability, including dementia and depression.
JVO conducted the analyses and drafted the first version of the manuscript. JPC designed the study and wrote various sections of the manuscript. JLB, JAI, AB, FBP, GFM, FJG, FGO, JGB, IM, PMM, RM, FR, FRP, FA, PS and MSM contributed equally to the study design, data collection, and drafting of the manuscript.
FundingThis project, led by J. de Pedro-Cuesta, was supported by the Pfizer Foundation and by the RECSP C03-09, CIEN C03-06 and CIBERNED and CIBERSAM research networks.
Conflict of interestThe authors declare that they have no conflict of interest associated with the publication of this article.
The authors are indebted to the research assistants who performed fieldwork data collection. Drs. Sara Herrera and José L. Vázquez-Barquero (Hospital Universitario Marqués de Valdecilla) provided scientific advice and training. Prof. Laura Fratiglioni (Karolinska Institute) facilitated access to materials from the National Swedish Study on Aging and Care, used as the basis for some of the materials in the present study. This article is the result of a joint effort by the Spanish Epidemiological Study Group on Aging, whose members are identified below:
- –
National Center for Epidemiology, Carlos III Institute of Public Health, Madrid: Javier Almazán, José Luis del Barrio, Raquel Boix, Fuencisla Avellanal, Pablo Martínez, María José Medrano, Jesús de Pedro-Cuesta, Francisco Javier Virués.
- –
Neurology Unit, Miguel Hernández University, General University Teaching Hospital, Alicante: Manuel Girón, Jordi Matías-Guiu, José Manuel Moltó.
- –
Dementia Diagnosis and Treatment Unit, Neurology Department, Bellvitge University Teaching Hospital, El Prat de Llobregat, Barcelona: Jordi Gascón, Ramón Reñé.
- –
Psychiatry Department, University of Santiago de Compostela (USC) and Psychogeriatrics Unit, Santiago de Compostela University Teaching Hospital, Santiago de Compostela, La Coruña: Carmen García, Raimundo Mateos, Ramón Ramos.
- –
Clinical Epidemiology-Research Unit, La Paz University Teaching Hospital, Madrid. EPICARDIAN Project: Margarita Alonso, Cristina Fernández, Rafael Gabriel.
- –
Dementia Unit, Santa Caterina Hospital, Gerona: Josep Garré-Olmo, Secundino López-Pousa, Jordi Llinàs-Reglà, Joan Vilalta-Franch.
- –
Department of Psychiatry, Granada University, Granada: Jorge Cervilla.
- –
Neurology Department, Donostia Hospital, Bidasoa-Hondarribia Hospital, Guipúzcoa: Ana de Arce, Alberto Bergareche.
- –
Economics and Geography Institute, Scientific Research Board, Madrid: Gloria Mayoralas, Fermina Rojo.
- –
Department of Preventive Medicine, Madrid Autonomous University, Madrid Regional Health Authority, Madrid. Leganés Project: Ángel Otero, Ángel Rodríguez.
- –
Neurology Department, 12 de Octubre University Teaching Hospital, Madrid. NEDICES Project: Julián Benito, Félix Bermejo-Pareja, Jaime Díaz, Rafael Gabriel, Candelas Gómez Mateos, Javier Guzmán, José Manuel Morales, Fernando Sánchez, Patricia Vale, Saturio Vega.
- –
Neurology Unit, Virgen del Camino Hospital, Pamplona: José María Manubens†.
- –
Hospital do Salnés, Pontevedra: Manuel Seijo-Martínez.
- –
Pontevedra General Provincial Hospital, Pontevedra: Ángel Aneiros, Ramón Suarez, Eugenio Torres.
- –
Neurology Unit, Segovia General Hospital, Segovia: Jacinto Duarte, Amelia Mendoza, Fernanda Rodríguez.
- –
Geriatrics Unit, Virgen del Valle Geriatric Hospital, Toledo: Francisco José García.
- –
Department of Medicine and Psychiatry, Zaragoza University, Zaragoza: Antonio Lobo, Pedro Saz.


