

In Spain, official information on waiting times for surgery is based on the interval between the indication for surgery and its performance. We aimed to estimate total waiting times for surgical procedures, including outpatient visits and diagnostic tests prior to surgery. In addition, we propose an alternative system to manage total waiting times that reduces variability and maximum waiting times without increasing the use of health care resources. This system is illustrated by three surgical procedures: cholecystectomy, carpal tunnel release and inguinal/femoral hernia repair.
MethodsUsing data from two Autonomous Communities, we adjusted, through simulation, a theoretical distribution of the total waiting time assuming independence of the waiting times of each stage of the clinical procedure. We show an alternative system in which the waiting time for the second consultation is established according to the time previously waited for the first consultation.
ResultsAverage total waiting times for cholecystectomy, carpal tunnel release and inguinal/femoral hernia repair were 331, 355 and 137 days, respectively (official data are 83, 68 and 73 days, respectively). Using different negative correlations between waiting times for subsequent consultations would reduce maximum waiting times by between 2% and 15% and substantially reduce heterogeneity among patients, without generating higher resource use.
ConclusionTotal waiting times are between two and five times higher than those officially published. The relationship between the waiting times at each stage of the medical procedure may be used to decrease variability and maximum waiting times.
En España, la información oficial sobre tiempos de espera para cirugía está basada en el tiempo desde que se indica la cirugía hasta que se realiza. Nuestro objetivo es estimar el tiempo de espera total considerando también la visita al especialista y las pruebas diagnósticas previas a la cirugía, y proponer un sistema alternativo para gestionar tiempos de espera totales que reduce la variabilidad y los tiempos máximos sin incrementar los de recursos. Se ilustra para tres procedimientos quirúrgicos: colecistectomía, reparación quirúrgica del túnel carpiano y de la hernia inguinal/femoral.
MétodosCon datos de dos Comunidades Autónomas, se ajusta mediante simulación, una distribución teórica del tiempo de espera total, asumiendo independencia de los tiempos de cada etapa del proceso asistencial. Se muestra un sistema alternativo donde el tiempo de espera para la segunda consulta se establece condicionado al esperado previamente en la primera consulta.
ResultadosLos tiempos de espera totales medios para la colecistectomía, túnel carpiano y hernia inguinal/femoral son 331, 355 y 137 días, siendo los oficiales 83, 68 y 73, respectivamente. Utilizando diferentes correlaciones negativas entre los tiempos de espera de consultas sucesivas se reducirían tanto los tiempos de espera máximos (entre el 2% y el 15%) como la heterogeneidad entre pacientes, sin mayor uso de recursos.
ConclusiónLos tiempos totales de espera son entre dos y cinco veces mayores que los publicados oficialmente. La relación entre tiempos de espera en cada etapa del procedimiento puede utilizarse para reducir la variabilidad y los tiempos máximos de espera.
Waiting times are the main rationing instrument in those publicly funded health care systems with a zero (or low) monetary price at the delivery point. They are a primary concern from both a social and political point of view.1 In the Spanish National Health System (SNHS), waiting times are the worst valued aspect of hospital services. More than 60% of citizens consider that this problem has not been solved, or has even worsened.2
The official information on waiting times is regulated by the Royal Decree 605/2003.3 Information on waiting times (except for emergency waiting, and organ transplantations) is published every six months by the Ministry of Health Care, Social Services and Equality (data for the whole country) and by each of the 17 “Autonomous Communities” (hereinafter regions). Despite the standardization of definitions and the regulation of public disclosure of information, the regions provide heterogeneous information in their official web pages, so that comparisons between regions based on this information are not possible. In addition, waiting times are published by type of service (outpatient consultations, diagnostic procedures, and surgery), showing no data about the actual time that patients have to wait from the beginning to the end of their clinical procedures. In particular, for surgery, patients are registered on a waiting list, when the specialist indicates surgery, but in all probability, their route throughout the health care system has started months before, waiting for outpatient consultations and diagnostic tests.
Usefulness of waiting time information has been studied previously. Smith, in a research undertaken into three Scottish hospitals with data at patient level, analysed whether the time on a hospital waiting list for several elective surgical procedures is a valid indicator for the total time that patients have to wait before surgery. Results show that waiting time to be attended in a hospital proves to be half the total waiting time -defined as the time spent from the first related visit to the general practitioner to the date of surgery; the remaining waiting time is due to outpatient consultations and the time waiting between lists.4 In Canada, Olson and De Gara, also with data at patient level, measured total waiting times for cholecystectomy, breast cancer resection and colorectal cancer resection. Total waiting time was defined as the sum of the time in days from the initial referral by the general practitioner to the surgeon and the time from the first visit to the surgeon to operation (considering time for diagnosis tests if required).5 In Spain, Bernal also considers that the compartmentalized approach to the waiting list is the most relevant shortcoming in these information systems, since the procedure is not considered as a whole but as independent stages.6 Peiró and Ridao point out the cross nature of waiting lists in Spain, assuming that patients only wait for a specific procedure. They give an example of patients diagnosed with neoplasm that have to wait for several months, but according to official data, they never wait more than a month.7,8
On the basis of the official information on waiting times and lists, this study carries out an analysis of the total waiting times in three elective surgical procedures: cholecystectomy, carpal tunnel release and inguinal/femoral hernia repair. For them, patients have to visit the specialist, and go through diagnostic procedures and surgery, successively. Each procedure has its own independent waiting list in the information system. The results obtained in the current system are compared to those under an improved management system, in which the waiting times in the different stages were not independent but conditioned to the total waiting time elapsed by patients in the previous steps of the procedure.
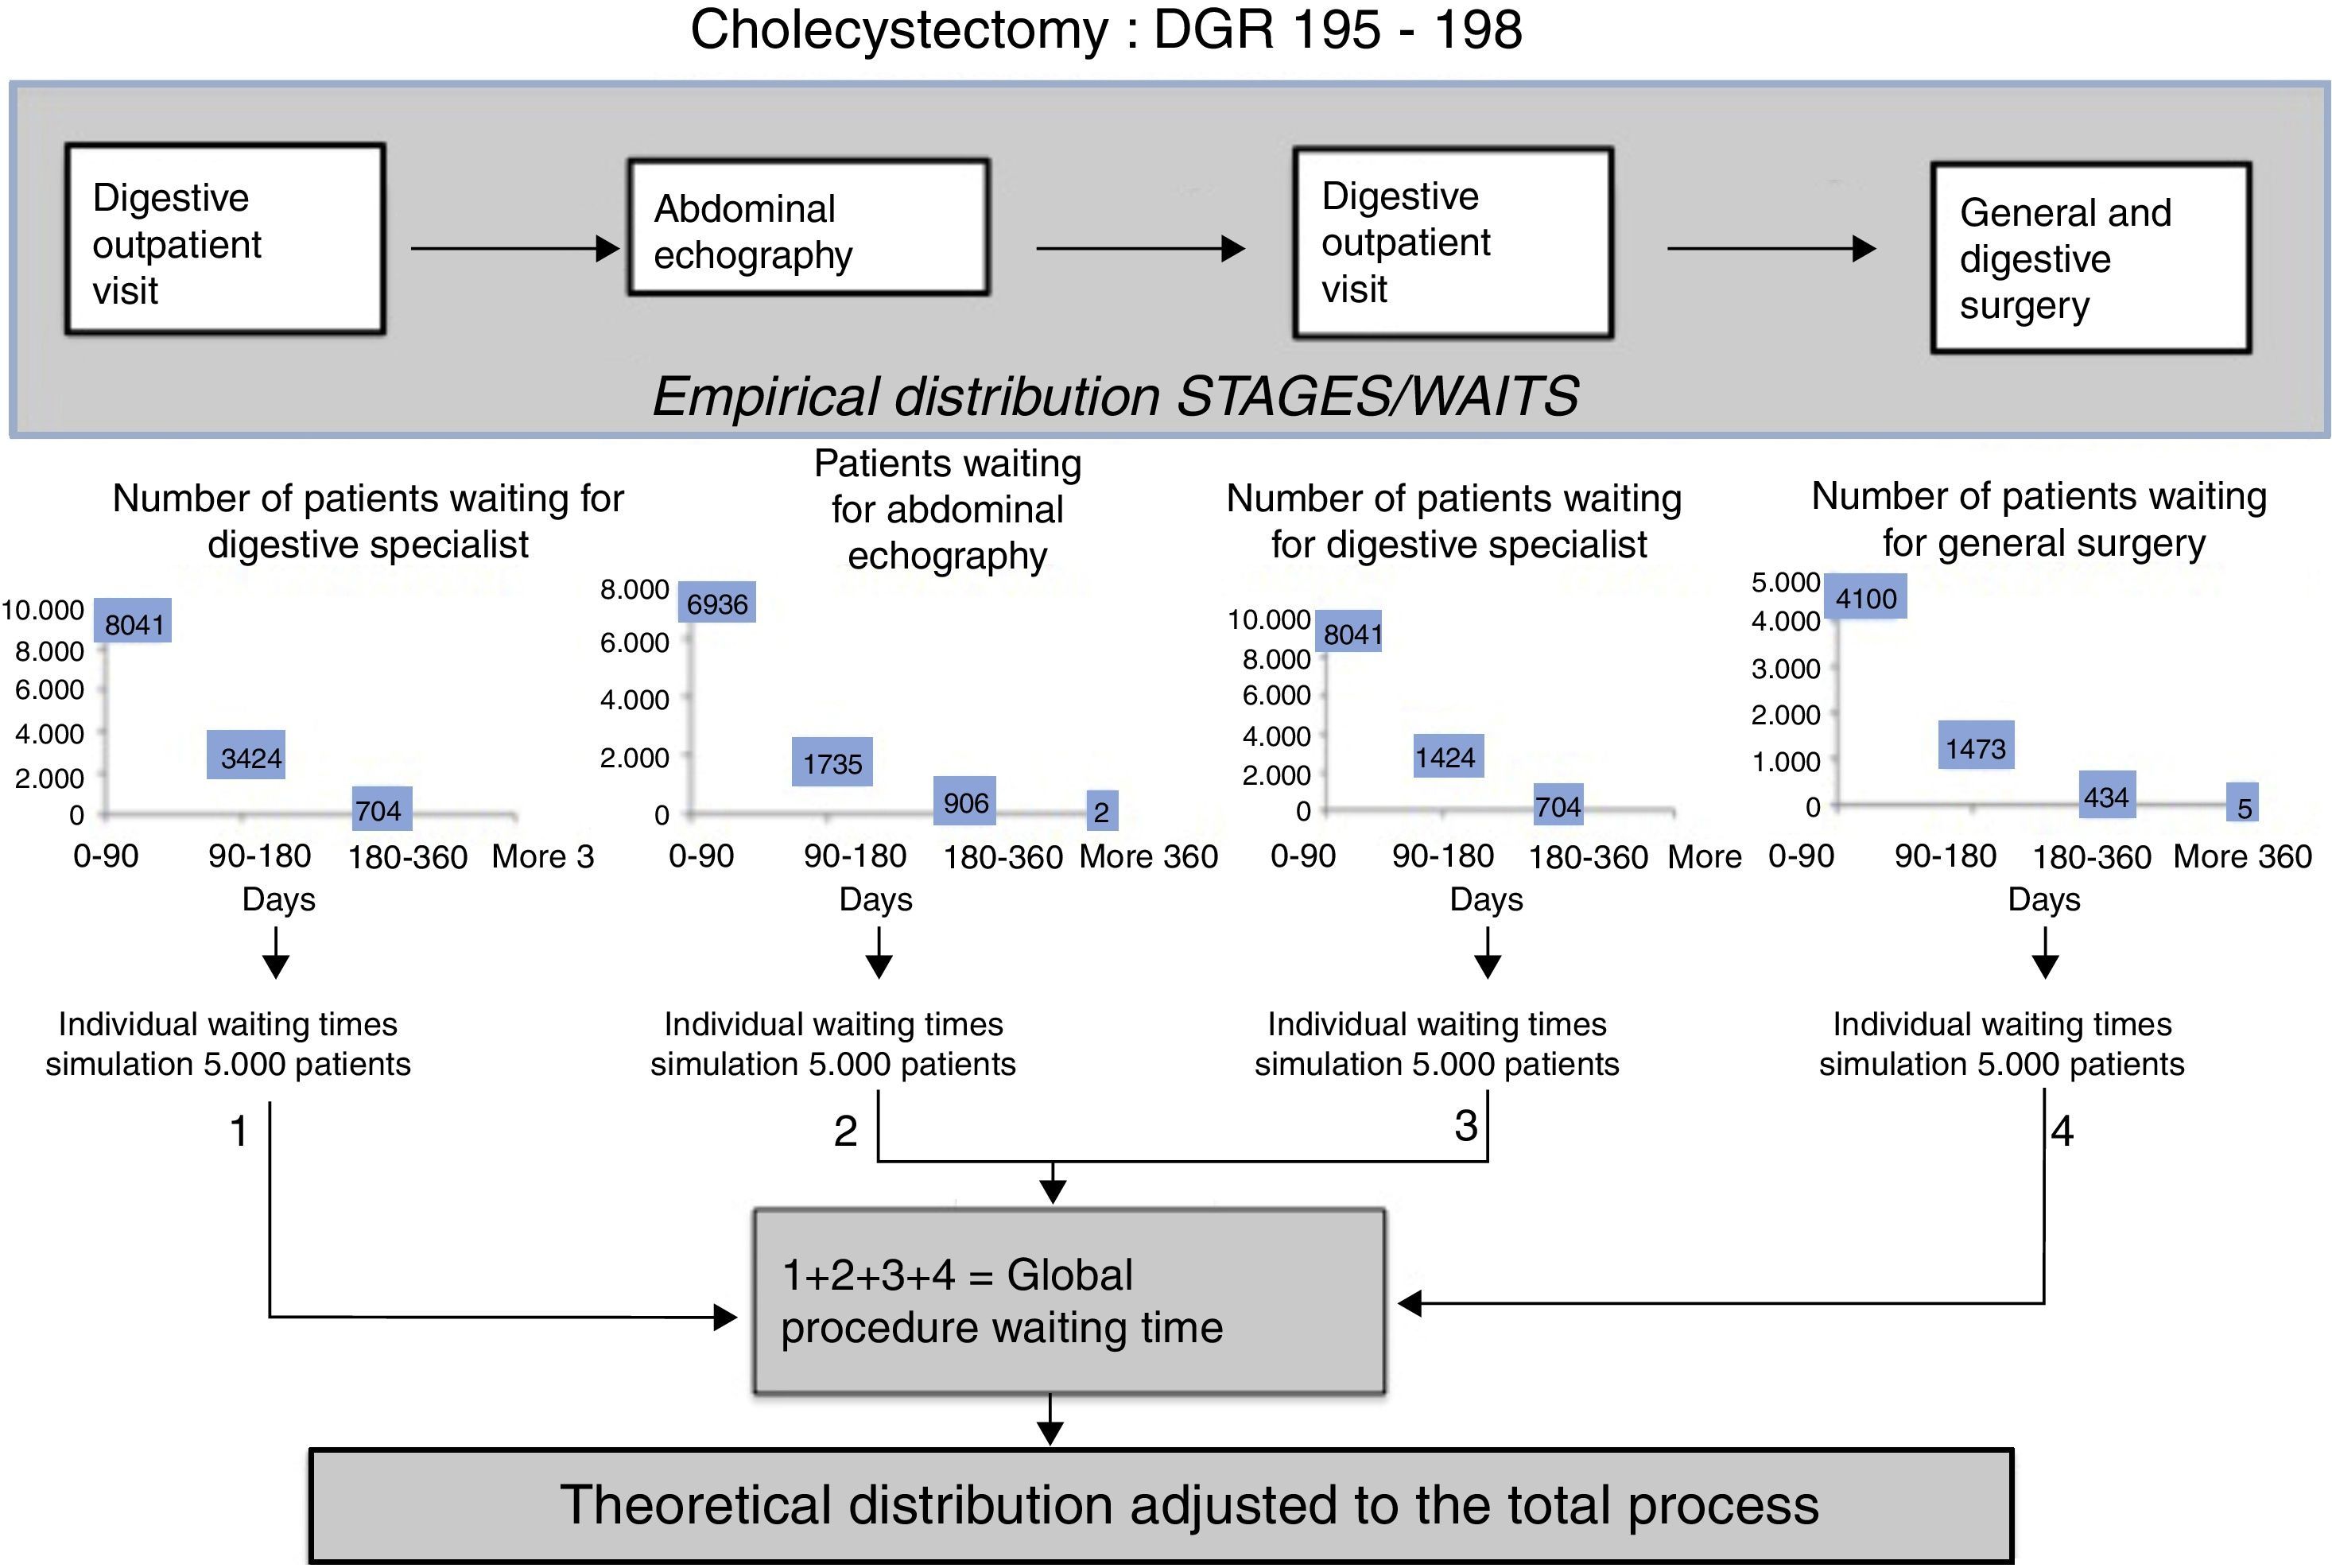
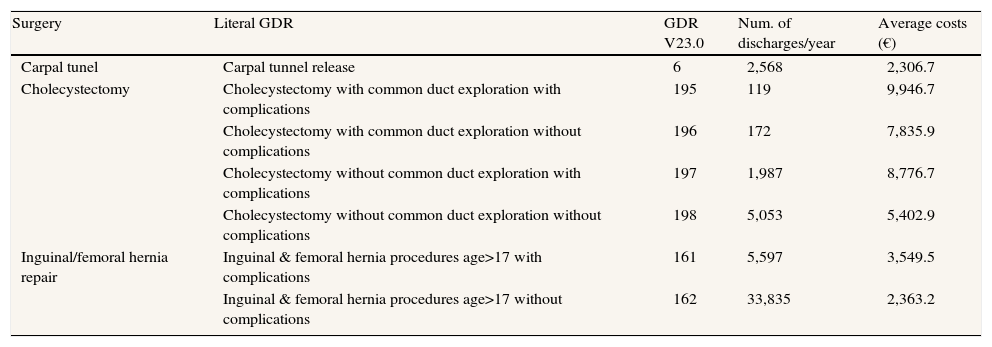
MethodsEstimation of total waiting time for surgical proceduresIn a first stage, total waiting times for several surgical procedures are estimated. Total waiting time for surgery is then defined as the sum of the waiting times for each stage of the whole clinical procedure, i.e. waiting times for the first outpatient visit, for the diagnostic tests, for the second outpatient visit and for surgery. The unavailability of sufficient and homogenous information has restricted and determined the surgical procedures whose total waiting times are estimated: cholecystectomy, carpal tunnel release and hernia repair. Their Diagnosis Related Groups (DRGs) are detailed in Table 1.
National rule for the DRG (AP-DRG V23). Spanish National Health Service 2008.
| Surgery | Literal GDR | GDR V23.0 | Num. of discharges/year | Average costs (€) |
| Carpal tunel | Carpal tunnel release | 6 | 2,568 | 2,306.7 |
| Cholecystectomy | Cholecystectomy with common duct exploration with complications | 195 | 119 | 9,946.7 |
| Cholecystectomy with common duct exploration without complications | 196 | 172 | 7,835.9 | |
| Cholecystectomy without common duct exploration with complications | 197 | 1,987 | 8,776.7 | |
| Cholecystectomy without common duct exploration without complications | 198 | 5,053 | 5,402.9 | |
| Inguinal/femoral hernia repair | Inguinal & femoral hernia procedures age>17 with complications | 161 | 5,597 | 3,549.5 |
| Inguinal & femoral hernia procedures age>17 without complications | 162 | 33,835 | 2,363.2 |
Source: Ministry of Health, Social Policy and Equality http://www.msps.es/estadEstudios/estadisticas/docs/NormaGRD2008/NORMA_2008_AP_GRD_V23_TOTAL_SNS.pdf
Surgical procedures due to inguinal/femoral hernia repair represent approximately 1% of all hospital discharges in Spain, with a mean hospital stay of between 2 and 7 days, depending on the specific DRG, and a case-mix weight of 0.9171 when complications are present. Cholecystectomy involves much longer mean stays, between 8 and 21 days, so these DRGs are among those with the highest mean costs, between 5,500 and 9,900 euros per patient. Carpal tunnel release procedure was carried out on 2,568 cases in 2008 with a 0.5960 case-mix weight.9 Therefore, these are procedures with a non-negligible social and economic impact.
Regions are supposed to provide information on the empirical distribution of the number of patients on structural waiting lists per time span (up to 90 days, between 91 and 180 days, between 181 and 360 days, and over 360 days) for each stage/waiting time (outpatient consultations, diagnostic and surgical procedures) for several procedures and services. The ‘structural waiting time’ includes those patients that, at a given time, are waiting to be seen for a first consultation, a first diagnostic/therapeutic procedure, or waiting to be operated, and with a waiting time attributable to the organization and availability of resources.3 A comparison between various regions based on public information is almost impossible, as only two of them –Galicia and Murcia– disclose enough information on waiting times to analyse these procedures. Therefore, data were taken, from the two abovementioned regional health care systems’ web pages on the 31st December, 2009.10,11 Specifically, data to estimate waiting times for cholecystectomy and inguinal/femoral hernia repair have been taken from the Regional Health Service of Galicia, whilst data for carpal tunnel have been obtained from the Regional Health Service of Murcia (we undertake a simulation exercise that could be applied to other regions or years).
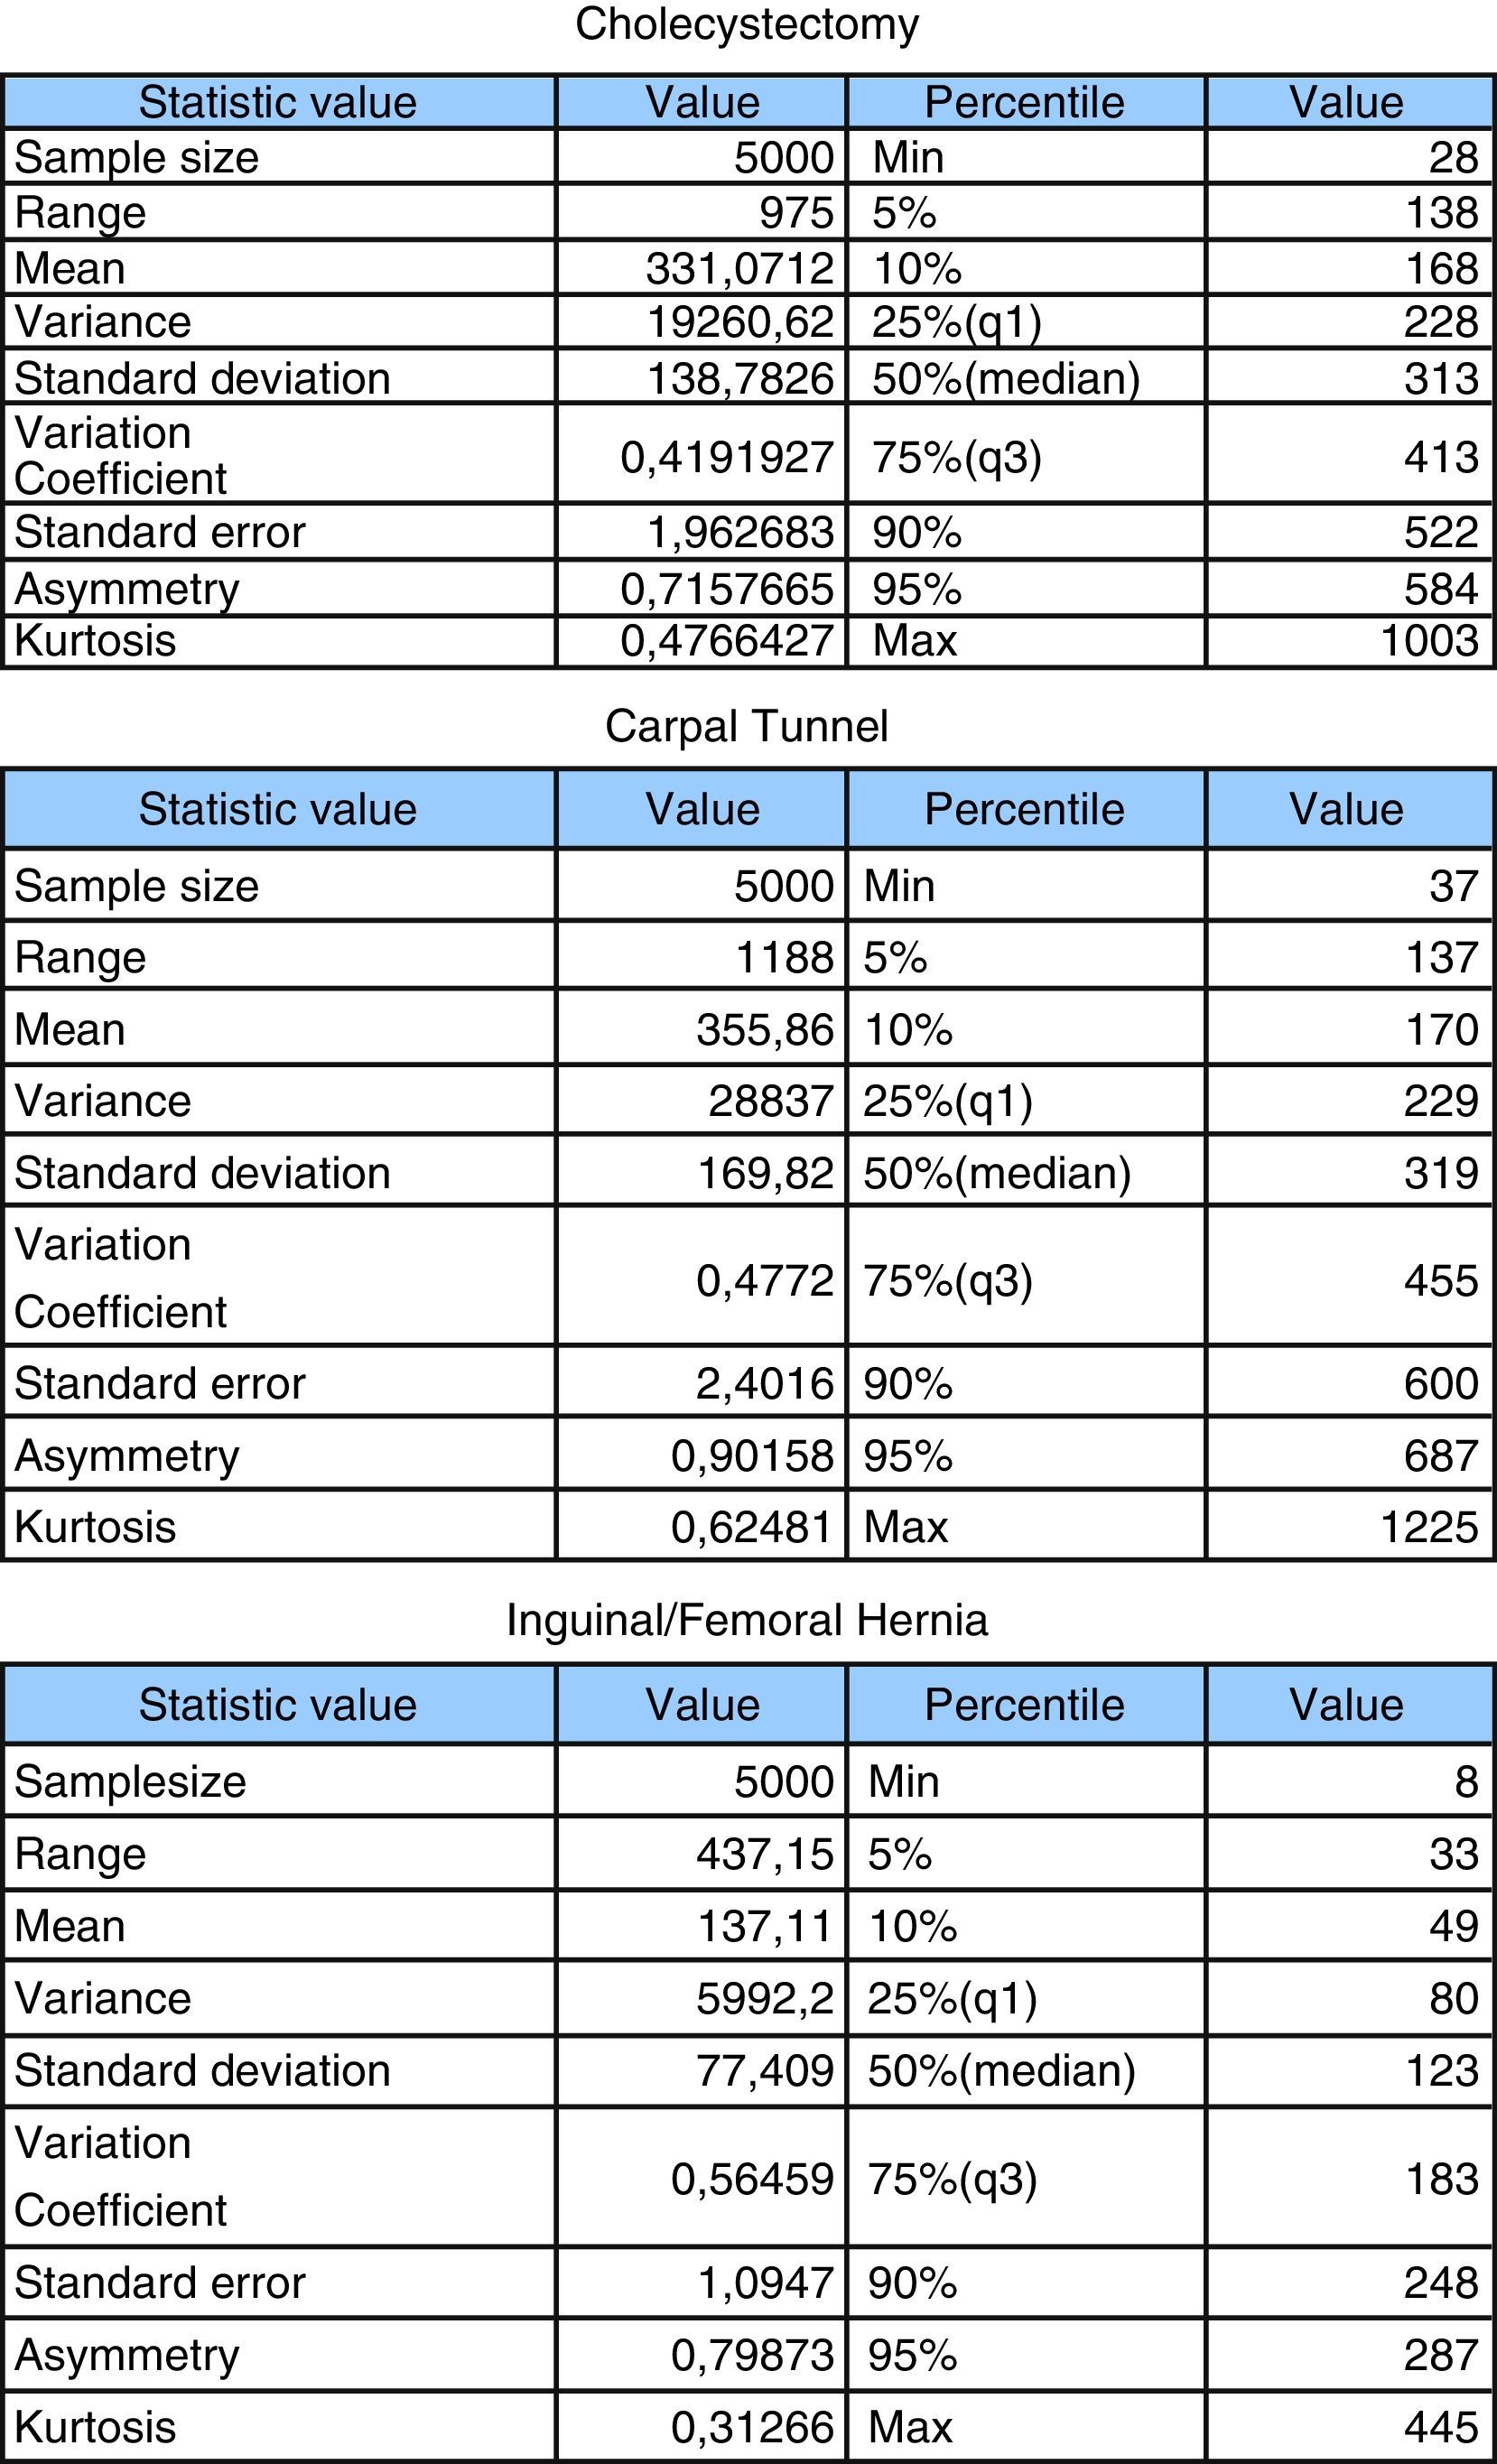
From this information, a sufficiently high number of observations were simulated (250,000) for each waiting time distribution, in order to estimate the best theoretical distribution for each stage of the procedure. Subsequently, the total waiting time for each patient was obtained by adding together the simulated waiting times for each stage of the medical procedure (which are assumed to be independent, as happens in the current situation). We then adjusted a probability distribution to the total waiting time in the three procedures. Finally, these distributions’ characteristics were analysed regarding the mean and maximum waiting times, waiting lists, etc. As an example, Figure 1 shows the specific situation for the cholecystectomy procedure.

Software Easyfit 5.3 Professional was used to calculate the theoretical distributions that best represent the empirical data. This allowed us to choose the distribution of the hypothetical waiting list of total waiting time per patient. This software simulates the adjustment for more than 60 distributions, with a wide range of heuristic tests (F, Survival, risk and cumulative risk functions, quartile comparison, and probability) and three goodness-of-fit tests (Kolmogorov-Smirnov, Anderson-Darling and Chi-square tests).
Effects of a change in the waiting list management systemIn order to reduce total waiting time variability among patients of a given surgical condition and also to reduce maximum total waiting times and the number of patients waiting more than a certain time, we have conditioned the waiting time of the second outpatient consultation on the time waited for previous consultations, in such a way that a patient who has had a long wait for the first visit, has greater priority and is assigned a shorter waiting time in the next visit (and vice versa). In this way, a negative correlation between waiting times is established (for specialist visits or diagnostic tests) when more than one takes place before the surgical procedure is carried out (i.e. this is the case for cholecystectomy and carpal tunnel, not for inguinal/femoral hernia repair, whose diagnosis just requires one visit to the specialist prior to surgery). Technically, this implies adding to our initial simulations the characteristic of lack of independency between observations (i.e. we generate correlated observations). We assume that all patients on the waiting list for each of the two surgical procedures analysed have the same clinical need.
As an example, we have undertaken such an exercise establishing negative correlations of 0.1, 0.3 and 0.5. Using the mathematical software Matlab, we obtained the correlated matrices for waiting times, in order to assess the changes produced by this proposal.
Cholesky decomposition is commonly used to simulate correlated variables.
To generate a sample of random numbers, (y1, y2,…, yn) with a mean distribution (μ1, μ2,…,μn) and covariance matrix Σ, we generate a sample of independent random variables (x1, x2,…, xn) with a normal distribution (0, 1).
Then the following decomposition of the covariance matrix is carried out with the Cholesky decomposition:

Finally, the new correlated variable is obtained (y1,…,yn):
Results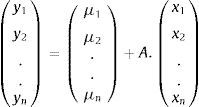
Figure 2 shows our estimations of the true total waiting time for the three procedures analysed. For cholecystectomy, the average total waiting time is 331 days. Only 5% of patients wait less than four and a half months; on the other hand, 90% of them wait more than half a year, and a considerable percentage of patients (50%) wait over a year. For a carpal tunnel release, the mean total waiting time is 355 days with 25% of patients waiting less than seven months, whereas one out of four patients waits more than fifteen months. For hernia repair procedure, the total waiting time is 137 days: half of the patients finish their procedures after four months, while 25% of cases do not end them until half a year later. There are even 10% of cases that are kept waiting for up to eight months.


If we compare the estimated total waiting times with the corresponding official published data at national level,12 it can be observed that for cholecystectomy, official average waiting time is 83 days (i.e. just 25% of the estimated total waiting time). For carpal tunnel, official waiting time is 68 days (i.e. only 19% of the total). And for hernia repair, the official time is 73 days (i.e. 53% of the total).
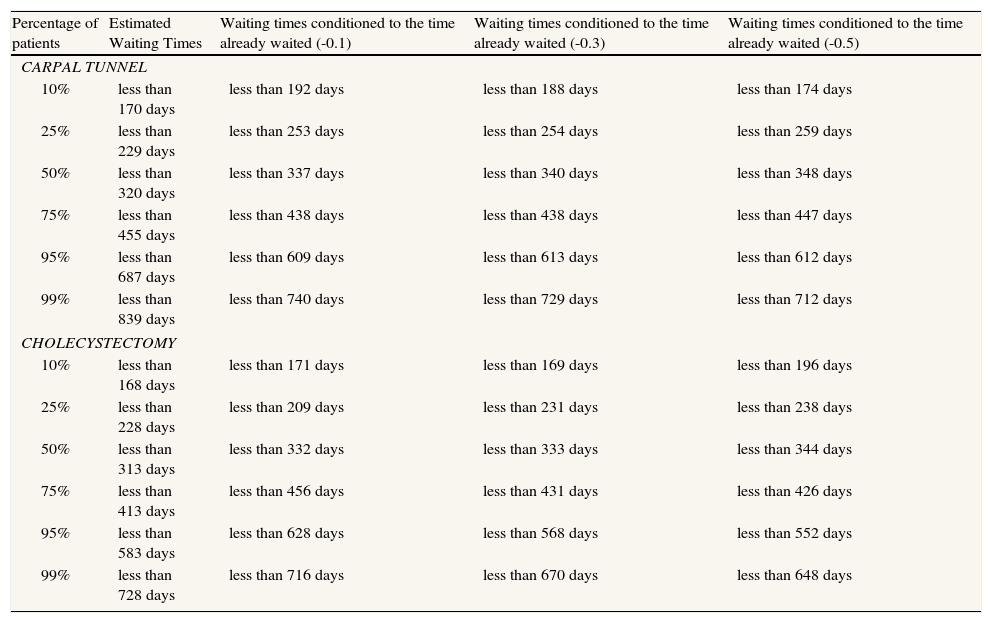
Regarding the simulation exercise of a hypothetical alternative waiting time management system, Table 2 shows the distribution of current waiting times, and the distribution of waiting times conditioned to the time that has been already waited for the previous consultation (assuming negative correlations of 0.1, 0.3 and 0.5) for cholecystectomy and carpal tunnel release procedures The distribution percentiles are compared. For carpal tunnel, the longest waiting times are reduced by 12%, 13% and 15%, (for the corresponding correlations); and for cholecystectomy, the longest waiting times are reduced by 2%, 8% and 11%, respectively. As we have forced mean times not to change, so as not to generate a higher use of resources, such a decrease lies on increasing the number of patients with the mean waiting time.
Distribution of current waiting times and the distribution of waiting times conditioned.
| Percentage of patients | Estimated Waiting Times | Waiting times conditioned to the time already waited (-0.1) | Waiting times conditioned to the time already waited (-0.3) | Waiting times conditioned to the time already waited (-0.5) |
| CARPAL TUNNEL | ||||
| 10% | less than 170 days | less than 192 days | less than 188 days | less than 174 days |
| 25% | less than 229 days | less than 253 days | less than 254 days | less than 259 days |
| 50% | less than 320 days | less than 337 days | less than 340 days | less than 348 days |
| 75% | less than 455 days | less than 438 days | less than 438 days | less than 447 days |
| 95% | less than 687 days | less than 609 days | less than 613 days | less than 612 days |
| 99% | less than 839 days | less than 740 days | less than 729 days | less than 712 days |
| CHOLECYSTECTOMY | ||||
| 10% | less than 168 days | less than 171 days | less than 169 days | less than 196 days |
| 25% | less than 228 days | less than 209 days | less than 231 days | less than 238 days |
| 50% | less than 313 days | less than 332 days | less than 333 days | less than 344 days |
| 75% | less than 413 days | less than 456 days | less than 431 days | less than 426 days |
| 95% | less than 583 days | less than 628 days | less than 568 days | less than 552 days |
| 99% | less than 728 days | less than 716 days | less than 670 days | less than 648 days |
In the SNHS the social perception that waiting times are increasing makes users distrust the health care system, and this is clearly reflected in their level of satisfaction with it.2,13 In addition, adequate waiting list management is an unavoidable social responsibility, due to its social and economic impact.14 Far from solving both problems, the current information, management and control of waiting times in specialized care have come to a standstill, with waiting time statistics that are useless for efficient health care system management and control.15
The situation in Spain contrasts with the public accountability of other countries. For example, the United Kingdom (UK) gives detailed and homogeneous information on waiting lists per health care centre and procedure, including specific information on the waiting times for cancer patients. In addition, in the UK, from 2008, waiting times were measured according to the ‘entire journey’, that is from initial referral to eventual treatment, including waits for specialist appointments or for diagnosis tests.16 The Canadian Institute for Health Information publishes waiting time information that allows for useful comparisons among provinces and territories.16 The Danish Health System has an information system that provides patients with information on expected waiting times (from referral to actual start of treatment) for conditions with uncomplicated health problems.16
In this study, we have tried to find and give useful information on surgical waiting times by estimating total waiting times in three surgical procedures. Total waiting times for cholecystectomy, carpal tunnel and inguinal/femoral hernia repair are approximately 11, 12 and 4.5 months, respectively. Other studies that have estimated total waiting times for cholecystectomy in Canada indicate significantly lower total waiting times, ranging from 83 to 106 days5 and 77 days.17 Our results also indicate that official waiting times only represent a quarter, a half and a fifth of real total waiting times of the three surgical procedures, respectively. These results show greater differences than those obtained by Smith in the United Kingdom, where the waiting time to be attended in the hospital was half the total waiting time –or waiting time after the G.P. consultation-, although he studied a wider range of surgical procedures (operations in general surgery, orthopaedics, urology, otolaryngology, ophthalmology and gynaecology).4
A common practice to reduce waiting lists is to establish guaranteed times, which restrict the maximum time to be waited. In Spain, guaranteed maximum waits have been established for certain surgical procedures, although they vary amongst the regions and there is no monitoring by health authorities. The results of our research suggest that these guaranteed times must be based on total waiting times, instead of just surgical waiting times, as currently happens. In addition, we have suggested an alternative system to manage waiting lists. As a result, a reduction in waiting times of those patient groups who wait longer (since mean times have to remain unchanged so as not to use more resources) is achieved by an increase in the number of people around the mean waiting time, thus improving time homogeneity within each procedure. Regarding its practical applicability, each regional health service should have a centralised information system of all patients waiting for each of the stages prior to surgery. When a doctor indicates a review consultation, the patient will be automatically allocated to the list depending on the time that s/he has already spent waiting for the first (diagnosis) visit: i.e. those who had waited relatively longer would now wait less and vice versa. The information system should have the corresponding software incorporated that calculates the waiting time for the subsequent procedures.
We are assuming that all patients on the waiting list for each surgical procedure have the same need for care, so there is no need to undertake any prioritization among them, apart from the waiting time criteria. Otherwise, we could generalize our method allowing for clusters of patients in the waiting list. Each cluster would represent a homogeneous group according to individual clinical characteristics of need. Priority classes would be defined, and we would establish also a discipline mechanism to regulate priorities among clusters, so that patients with less severe conditions would wait longer.
Assuming equal clinical need for the same surgical procedure is a strong assumption as it is likely that different patients have different ages, severity of condition, comorbidities and other characteristics that are directly related to their medical needs; however, there is no patient level information of this sort available. In addition, we are considering patients that are waiting for two elective surgery conditions (cholecystectomy and carpal tunnel), which do not involve medical emergencies. So any differences in waiting times among patients should be minimised for equity reasons.
We are aware that other criteria might improve the prioritization system. For instance, in Spain, a recent work18 has developed a prioritization system for elective surgical procedures based not only on patients’ waiting times, but also on other ad hoc criteria, such as the effect on quality of life, the risk of complications during the wait, the clinical effectiveness of the intervention and the use of resources and health care services during the wait. In other OECD countries, health systems have different approaches to waiting time information and prioritization. For instance, the Portuguese model has been successful in reducing waiting times by unifying the information on waiting times for all public and private health service providers and by the use of vouchers, allowing free choice of any provider for patients for whom 75% of maximum waiting times guaranteed are reached.16 In Australia, the Government introduced a plan, in 2008, which attempted to improve the elective surgery long term output by investing in information systems and day case surgery, and rewarding those states that were successful in reducing the proportion of patients not seen within clinically recommended times.16 Accountability and effective monitoring of waiting time information is also important; a good example is New South Wales, where in 2009, an independent agency with the goal of excellence in the delivery of timely accurate and comparable information was established.16
To conclude, in Spain, current information systems on waiting times generate data that are neither sufficient nor useful to improve the management of waiting lists. The relevant waiting time for efficient waiting lists management should comprise not only the surgical procedures but also the outpatient consultations and the diagnostic procedures that precede surgery. For the three elective surgery procedures analysed, total waiting times are two, four and five times higher than those officially published. The relationship between the waiting at each stage of the medical procedure may be used to decrease the waiting variability for a given health condition and to reduce the waiting time of those patients who wait the longest, being a useful device to reduce potential inequalities in the access to the health care system.
Published data on waiting times for surgery in the Spanish National Health Service do not include the time spent waiting in previous stages of the clinical process (i.e. outpatient visits and diagnosis tests), therefore generating data that is not useful to show real patients’ waiting times and to improve the management of waiting lists.
What does this study add to the literature?We propose a surgery waiting time allocation system that considers jointly the waiting time for surgery and for previous outpatient visits and diagnosis tests, illustrating it for three elective surgery procedures. With this system, variability and maximum waiting times are reduced without increasing the use of health care resources, therefore contributing to lower inequalities in the access to these health care services with no additional cost.
Carlos Álvarez-Dardet.
Contributions of authorshipAll authors contributed to the conception, design and elaboration of the final version of the manuscript. Specifically, Jiménez has contributed to the selection and specification of the clinical conditions; González and Barber have undertaken the collection of data and the estimation and simulation processes, together with their interpretation; and Abásolo has contributed to the selection of contents, elaboration of the discussion section and manuscript writing. All authors read and approved the final manuscript.
FundingWe are grateful to the Ministry of Science and Innovation of Spain (research project ECO2010-21558) and to the Spanish Ministry of Economy and Competitiveness (research project ECO2012-36150).
Conflicts of interestsThe authors declare that they have no conflicts of interests.
We are grateful to three anonymous referees of Gaceta Sanitaria for their comments.


