

To estimate the number of collateral casualties associated with road users considered responsible for a road crash.
MethodWe analyzed the case series comprising all 790,435 road users involved in road crashes with victims in Spain from 2009 to 2013, recorded in a nationwide police-based registry. For each road user assumed to be responsible for a crash, we collected information relative to health outcomes in other people involved in it, and obtained the total number of collateral casualties per 100 road users considered responsible for the crash. We then estimated the strength of associations between sex, age and the number of collateral casualties generated by car drivers considered responsible for the crash, and calculated rate ratios and corresponding 95% confidence intervals.
ResultsPedestrians responsible for crashes were associated with the lowest number of collateral casualties (13.1/100), whereas the highest number (153/100) was observed for bus drivers responsible for crashes. Car drivers were associated with 104.4/100 collateral casualties. The youngest and the oldest car drivers responsible for crashes were associated with 33% and 41% more deaths, respectively, than the 25–34 year old group. Male drivers were associated with 22% more collateral casualties than female drivers.
ConclusionsRegardless of the type of road user who was responsible for a road crash, their active contribution to the crash led to an additional number of collateral casualties in other, non-responsible users. The number and severity of collateral casualties were related to the type of vehicle and the number of people involved. These results are potentially useful to support the need to promote safer driver practices among subgroups of high-risk drivers.
Estimar el número de víctimas colaterales asociadas a los usuarios de las vías de tráfico responsables de una colisión.
MétodoSe estudió la serie de casos formada por los 790.435 usuarios de la vía implicados en accidentes de tráfico con víctimas en España, entre 2009 y 2013, recogidos en el Registro de Accidentes de Tráfico con Víctimas de la Dirección General de Tráfico. Para cada uno de los usuarios considerado responsable se recogió información sobre las consecuencias sanitarias para las otras personas implicadas en el mismo accidente, y se calculó el número total de víctimas colaterales por cada 100 usuarios responsables. A continuación se estimó la fuerza de asociación de la edad y el sexo de los conductores de turismo con el número de víctimas colaterales generadas por ellos, y se obtuvieron las correspondientes razones de tasas y sus intervalos de confianza del 95%.
ResultadosLos peatones responsables de atropellos se asociaron al menor número de víctimas colaterales (13,1/100), mientras que la cifra más alta de estas (153/100) se asoció a los conductores de autobús responsables del accidente. Los de turismo implicaron a 104,4/100. Los conductores de turismo más jóvenes (<25 años) y los de mayor edad (>64 años) implicaron respectivamente un 33% y un 41% más de víctimas colaterales que el grupo de 25-34 años. Los varones se asociaron a un 22% más de víctimas colaterales que las mujeres.
ConclusionesIndependientemente del tipo de usuario responsable del accidente, su contribución activa se asoció a un número adicional de víctimas colaterales, cuyas magnitud y gravedad dependieron sobre todo del tipo de vehículo conducido. Este trabajo puede ser útil para reforzar las actuaciones destinadas a prevenir la accidentalidad en los usuarios de alto riesgo.
When a road user (driver or pedestrian) causes a road crash with casualties, the health consequences affect not only this user, but also other persons passively involved in the crash including drivers and passengers in the other vehicles, and non-responsible pedestrians. We have found no previous studies designed to estimate the number or impact of these collateral casualties, or the impact on collateral casualties of factors such as the type of vehicle or the age and sex of the road user responsible for the crash. Using data from the Spanish registry of road crashes with victims from 2009 to 2013, we designed the present study to estimate the number of collateral casualties associated with road users responsible for a road crash, and stratified this figure by the severity of collateral casualties, the type of vehicle, and —for crashes caused by a private car— by the driver's age and sex.
MethodWe analyzed the case series comprising all 790,435 road users (732,301 drivers and 58,134 pedestrians) involved in road crashes with victims in Spain from 2009 and 2013, recorded in the Spanish National Registry of Road Crashes with Victims maintained by the Spanish Directorate General of Traffic. This is a nationwide police-based registry containing information recorded by the police officer at the scene of each crash about the characteristics of the crash and all vehicles and persons involved.1,2 Its main characteristics have been described in previous articles.3 Three of the variables included in the registry are the type of crash (single crash, collision between two or more vehicles, and collisions involving pedestrians), the number of vehicles involved, and the commission of any infraction by drivers and/or pedestrians involved in the crash. From these variables we identified the subgroup of road users who probably caused the crash, which included the following four types of road users:
- •
All drivers of vehicles involved in single crashes (i.e., crashes involving only one vehicle and no pedestrians).
- •
Infractor drivers involved in collisions between two or more vehicles in which the remaining driver(s) did not commit any infraction (i.e., collisions with only one infractor driver).
- •
Infractor drivers involved in collisions with one or more pedestrians in which the pedestrian(s) did not commit any infraction.
- •
Infractor pedestrians involved in collisions with a vehicle whose driver did not commit any infraction.
Therefore, the following subtypes of collisions (and the drivers and/or pedestrians involved on them) were excluded from the study:
- •
Between two or more vehicles or between a vehicle and a pedestrian without information regarding the commission or not of infractions by one or more of the road users involved (n = 68,278 collisions).
- •
Involving two or more road users in which no infractions were recorded for any of them (n = 46,526 collisions).
- •
Involving two or more road users in which any infraction was recorded for two or more of them (n = 49,277 collisions).
We identified a total of 254,629 road users (of whom 6,903 were pedestrians) responsible for as many road crashes. For each responsible road user we collected information from the registry regarding their health outcome (death, severe injury, mild injury, no injury) as well as the total number of people who died or who sustained severe or mild injuries in the crash. By subtracting the number of deaths and injuries among responsible road users from the number of deaths and injuries among all people involved in the crashes, we obtained the number of collateral deaths, severe and mild injuries in each crash. For example, consider a multiple collision resulting in two deaths and severe injuries in two other people. If the responsible driver was one of the two severely injured people, the total number of collateral casualties would be three (two deaths and one person severely injured). We multiplied this figure by 100 to obtain the total number of collateral casualties (stratified by death, severe injury and mild injury) per 100 road users considered responsible for the crash. These figures were subsequently stratified according to the type of road user (pedestrian, cyclist, moped driver, motorcycle driver, private car driver, tractor/machinery driver, driver of a truck weighing less than 3500kg, pickup truck driver, driver of a truck weighing 3500kg or more, bus driver, other drivers/unknown). For the subgroup of private car drivers (by far the largest subgroup) considered responsible for the crash, we stratified collateral casualties according to the driver's sex and age group (<25 years, 25 to 34, 35 to 64, and >64 years). To estimate the strength of association between these variables and the number of collateral casualties, we calculated the corresponding rate ratios with car drivers, females and the 25 to 35 year age subgroup as the reference categories. The corresponding 95% confidence intervals (95%CI) for these estimates were also obtained, assuming that the number of collateral casualties for each category approximately followed a Poisson distribution. All analyses were done with the Stata statistical package (version 14).4
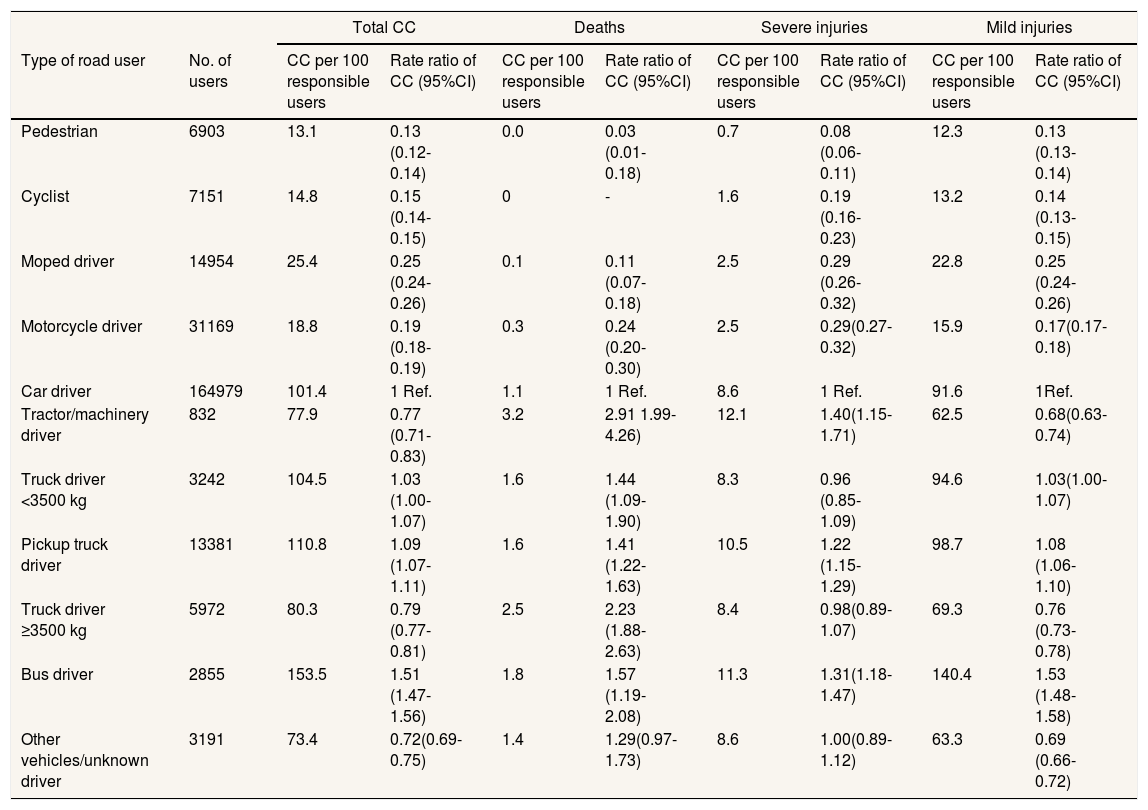
ResultsTable 1 shows the number of collateral casualties per 100 road users responsible for crashes, stratified according to the type of road user and severity of the collateral casualties. Unsurprisingly, pedestrians who caused a crash were the user group associated with the lowest number of collateral casualties (13.1/100) (i.e., every 100 pedestrians responsible for a collision with a vehicle were associated with 13.3 additional casualties), and most of them were mild injuries. In contrast, bus drivers responsible for road crashes were associated with the highest number of collateral casualties (153/100). However, the responsible road user group associated with the highest number of severe collateral casualties was tractor/heavy machinery drivers: 3.2 deaths and 12.1 severely injured people per 100 road users of these vehicles. Among private car drivers, there were 101.4 collateral casualties per 100 road users of this type (one death, 8.6 severe injuries and 91.6 mild injuries).
Collateral casualties per 100 road users responsible for road crashes in Spain from 2009 to 2013.
| Total CC | Deaths | Severe injuries | Mild injuries | ||||||
|---|---|---|---|---|---|---|---|---|---|
| Type of road user | No. of users | CC per 100 responsible users | Rate ratio of CC (95%CI) | CC per 100 responsible users | Rate ratio of CC (95%CI) | CC per 100 responsible users | Rate ratio of CC (95%CI) | CC per 100 responsible users | Rate ratio of CC (95%CI) |
| Pedestrian | 6903 | 13.1 | 0.13 (0.12-0.14) | 0.0 | 0.03 (0.01-0.18) | 0.7 | 0.08 (0.06-0.11) | 12.3 | 0.13 (0.13-0.14) |
| Cyclist | 7151 | 14.8 | 0.15 (0.14-0.15) | 0 | - | 1.6 | 0.19 (0.16-0.23) | 13.2 | 0.14 (0.13-0.15) |
| Moped driver | 14954 | 25.4 | 0.25 (0.24-0.26) | 0.1 | 0.11 (0.07-0.18) | 2.5 | 0.29 (0.26-0.32) | 22.8 | 0.25 (0.24-0.26) |
| Motorcycle driver | 31169 | 18.8 | 0.19 (0.18-0.19) | 0.3 | 0.24 (0.20-0.30) | 2.5 | 0.29(0.27-0.32) | 15.9 | 0.17(0.17-0.18) |
| Car driver | 164979 | 101.4 | 1 Ref. | 1.1 | 1 Ref. | 8.6 | 1 Ref. | 91.6 | 1Ref. |
| Tractor/machinery driver | 832 | 77.9 | 0.77 (0.71-0.83) | 3.2 | 2.91 1.99-4.26) | 12.1 | 1.40(1.15-1.71) | 62.5 | 0.68(0.63-0.74) |
| Truck driver <3500 kg | 3242 | 104.5 | 1.03 (1.00-1.07) | 1.6 | 1.44 (1.09-1.90) | 8.3 | 0.96 (0.85-1.09) | 94.6 | 1.03(1.00-1.07) |
| Pickup truck driver | 13381 | 110.8 | 1.09 (1.07-1.11) | 1.6 | 1.41 (1.22-1.63) | 10.5 | 1.22 (1.15-1.29) | 98.7 | 1.08 (1.06-1.10) |
| Truck driver ≥3500 kg | 5972 | 80.3 | 0.79 (0.77-0.81) | 2.5 | 2.23 (1.88-2.63) | 8.4 | 0.98(0.89-1.07) | 69.3 | 0.76 (0.73-0.78) |
| Bus driver | 2855 | 153.5 | 1.51 (1.47-1.56) | 1.8 | 1.57 (1.19-2.08) | 11.3 | 1.31(1.18-1.47) | 140.4 | 1.53 (1.48-1.58) |
| Other vehicles/unknown driver | 3191 | 73.4 | 0.72(0.69-0.75) | 1.4 | 1.29(0.97-1.73) | 8.6 | 1.00(0.89-1.12) | 63.3 | 0.69 (0.66-0.72) |
CC: collateral casualties; 95%CI: 95% confidence interval.
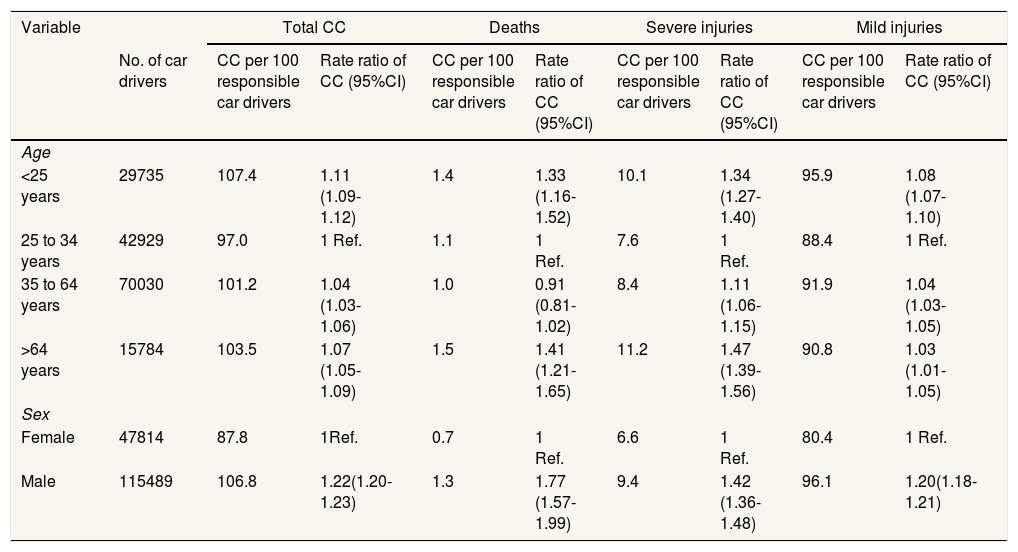
Table 2 shows the number and severity of collateral casualties resulting from road crashes caused by private car drivers, according to the driver's age and sex. Although the differences in the volume of total collateral casualties and mild injuries across age groups of responsible drivers were minimal, extreme age groups (younger than 25 and older than 64 years old) were associated with larger numbers of deaths and severe injuries compared to the 25 to 34 year old group. Specifically, drivers in the youngest group were associated with 33% more deaths and 34% more injuries, while for the oldest group of drivers these figures where 41% and 47%, respectively. The number of collateral casualties associated with male drivers was substantially higher than female drivers (106.8/100 vs. 87.8/100, a difference of 22%). These differences were especially large for severe outcomes (77% more deaths and 42% more severe injuries).
Collateral casualties per 100 car drivers responsible for road crashes in Spain from 2009 to 2013, according to driver's age and sex.
| Variable | Total CC | Deaths | Severe injuries | Mild injuries | |||||
|---|---|---|---|---|---|---|---|---|---|
| No. of car drivers | CC per 100 responsible car drivers | Rate ratio of CC (95%CI) | CC per 100 responsible car drivers | Rate ratio of CC (95%CI) | CC per 100 responsible car drivers | Rate ratio of CC (95%CI) | CC per 100 responsible car drivers | Rate ratio of CC (95%CI) | |
| Age | |||||||||
| <25 years | 29735 | 107.4 | 1.11 (1.09-1.12) | 1.4 | 1.33 (1.16-1.52) | 10.1 | 1.34 (1.27-1.40) | 95.9 | 1.08 (1.07-1.10) |
| 25 to 34 years | 42929 | 97.0 | 1 Ref. | 1.1 | 1 Ref. | 7.6 | 1 Ref. | 88.4 | 1 Ref. |
| 35 to 64 years | 70030 | 101.2 | 1.04 (1.03-1.06) | 1.0 | 0.91 (0.81-1.02) | 8.4 | 1.11 (1.06-1.15) | 91.9 | 1.04 (1.03-1.05) |
| >64 years | 15784 | 103.5 | 1.07 (1.05-1.09) | 1.5 | 1.41 (1.21-1.65) | 11.2 | 1.47 (1.39-1.56) | 90.8 | 1.03 (1.01-1.05) |
| Sex | |||||||||
| Female | 47814 | 87.8 | 1Ref. | 0.7 | 1 Ref. | 6.6 | 1 Ref. | 80.4 | 1 Ref. |
| Male | 115489 | 106.8 | 1.22(1.20-1.23) | 1.3 | 1.77 (1.57-1.99) | 9.4 | 1.42 (1.36-1.48) | 96.1 | 1.20(1.18-1.21) |
CC: collateral casualties; 95%CI: 95% confidence interval.
Our study confirms that in addition to the direct health consequences of traffic crashes, each driver or pedestrian considered responsible for causing a road crash appeared to generate an additional number of innocent collateral casualties. In addition, our results appear to support the hypothesis that the number and severity of collateral casualties depend mainly on the mass of the vehicle(s) and the number of persons involved in the crash. The combination of both factors may explain why bus drivers responsible for causing a crash wee the road users associated with the largest numbers of collateral casualties. The main contribution of our study is that we provide estimates of the number of collateral casualties in large sample of road crashes in Spain. For example, our results document that each private car driver responsible for a crash was associated with one additional collateral casualties, usually a mild injury. However, our results also bring to light some new insights which deserve further comment.
First, it is noteworthy that even the most vulnerable road users were associated with an additional number of collateral casualties when they were responsible for a crash. For example, 13 collateral casualties occurred per each 100 pedestrians responsible for causing a collision, 14 per 100 cyclists, and 19 per 100 moped drivers. Second, the number of severe collateral casualties (deaths and severe injuries) was higher among private car drivers responsible for road crashes who were less than 25 or more than 64 years old. In the youngest drivers, this excess may be attributable to their inexperience and lower risk perception, which result in their involvement in road crashes of higher intrinsic severity (i.e., occurring at higher speeds).5–8 However, this explanation may not be applicable to older drivers, whose driving style is usually associated with defensive behaviors and lower speeds.9–11 Other factors which may explain the excess collateral casualties for these two subgroups of drivers may be the use of vehicles that are less safe (older vehicles or vehicles equipped with fewer passive safety devices), and the presence of more passengers or more vulnerable passengers. In an attempt to test this hypothesis, we stratified the collateral casualties compiled in Table 2 according to the type of crash (single crash, collision between two or more vehicles, and collisions involving pedestrians) (see online Appendix). This stratified analysis showed that for both the youngest and oldest car drivers, but especially for the latter, excess collateral casualties occurred mainly in single crashes in which all collateral casualties were passengers of the only vehicle involved. Therefore, in addition to the presumably risky driving profile of the driver, the number and type of passengers may be another main determinant of the association we found between the oldest driver group and the severity of collateral casualties. For example, older passengers (more vulnerable than younger passengers to the effects of the energy released in a crash)12–14 may travel more frequently with older drivers than with younger ones. Finally, a notable finding was the considerable excess collateral casualties, especially severe collateral casualties, observed for male car drivers compared to females. This result may reflect the tendency of male drivers (especially younger ones) to be involved in crashes of higher intrinsic severity, a phenomenon widely reported in previous studies.15–19
Regarding the limitations of this study, we first note its observational design, which makes it impossible to propose a causal interpretation of our findings. Second, our study is based on a police-based registry, a data source with some well-known drawbacks20 that might have distorted our results in two ways:
Lack of external validity is one source of error. We assume that like any other police-based registry of road crashes, the database we used under-represents crashes of lesser severity.21–25 Therefore we may have overestimated the number of total (and especially severe) collateral casualties per 100 road users responsible for crashes.
Errors in the identification of the road user responsible for causing the crash is the second main limitation. In a crash involving only one vehicle and no pedestrians, assigning responsibility for the crash to the only driver involved is straightforward. However, this is not the case when two or more drivers or a pedestrian are also involved. We used the commission of infractions by drivers or pedestrians as a surrogate for responsibility, assuming that in a collision in which only one road user committed an infraction, the likelihood that this user was responsible for causing the collision is very high. However, we cannot entirely rule out misclassification bias associated with this procedure.
A further consideration of note is that our selection of road crashes caused by just one responsible road user (i.e., a driver or pedestrian) may raise some problems with extrapolating our results to road crashes with two or more responsible users. This could also limit the external validity of the study.
Our study confirms that regardless of the type of road user responsible for causing a crash, the driver's active contribution to the crash was associated with an additional number of innocent collateral casualties. The number and severity of these casualties were related to the type of vehicle and the number of people involved in the crash. However, for drivers of private cars who caused a crash, the number and severity of collateral casualties were also related to the driver's age and sex. It seems advisable to raise awareness in the subgroups of high-risk drivers (young males and older drivers) regarding their contribution to deaths and injuries in innocent road users (frequently, the passengers in the vehicles they drive) in order to support educational efforts aimed at convincing road users to adopt safer driver practices. The results of our study provide empirical support for the potential benefits of these efforts.
If a driver or a pedestrian causes a road crash, the health consequences may affect other people involved in the crash besides him/herself.
What does this study add to the literature?Pedestrians cause the lowest number of collateral casualties, while bus drivers cause the highest. Young male and older car drivers cause a higher number of collateral casualties compared to female and 25-34 year old drivers.
Carlos Álvarez-Dardet.
Transparency declarationThe corresponding author on behalf of the other authors guarantee the accuracy, transparency and honesty of the data and information contained in the study, that no relevant information has been omitted and that all discrepancies between authors have been adequately resolved and described.
Authorship contributionsP. Lardelli-Claret conceived the design of the study. E. Jiménez-Mejías and V. Martínez-Ruiz supervised all aspects of job performance L.M. Martín-De los Reyes, D. Molina-Soberanes and E. Moreno-Roldán conducted the statistical analysis. P. Lardelli-Claret, V. Martínez-Ruiz and E. Jiménez-Mejías wrote the manuscript. All authors have critically reviewed and made important intellectual contributions to the manuscript, so they agreed this final version.
AcknowledgementsWe wish to thank the Spanish Directorate General of Traffic for allowing access to their database of traffic accidents with victims, and K. Shashok for improving the use of English in the manuscript.
FundingNone.
Conflicts of interestNone.


